The Instrumentation Log window is almost always the best method for monitoring instrumentation as you debug. However, the Log window usually isn’t helpful if you are trying to log the actions leading up to a Panorama crash. Panorama crashes are rare, hopefully you’ll never need to worry about them. But if you find yourself in a situation where your code is causing Panorama to crash, the techniques described below will allow you to monitor every step of your code right up to the instant of the crash. Because these techniques use an external program to display the instrumentation log, the log will still be visible even after the crash has occurred, allowing you to examine it at your leisure and hopefully allowing you to see exactly where the crash occurs. Most likely you’ll never need this ability, but here at ProVUE we use these techniques to track down any crashes that occur while we are developing Panorama.
Real time instrumentation can be provided thru either Console.app or Terminal.app (when used for real-time monnitoring with Terminal.app, Panorama has to be launched from within Terminal.app instead of from the Finder, as explained below).
The downside of the techniques described on this page is that they require some special preparation to set up, and they are a bit more complicated to use. If you’re not anticipating a crash, it’s usually best to simply use the built in Instrumentation Log window.
Viewing Instrumentation with Console.app
To use Console.app for instrumentation monitoring, start by opening the Console app. This app is included with macOS: it’s located in the Utilities folder inside the Applications folder. Alternatively, you can open it from within Panorama by choosing Open Console,app from the Instrumentation menu. The Console window will look something like this:
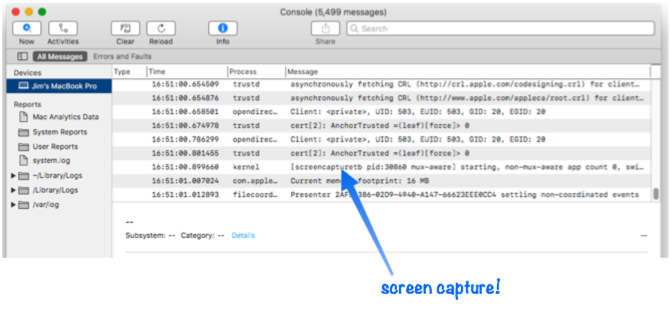
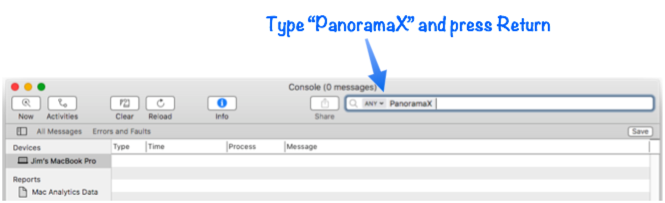
By default, the Console window displays a continuous firehose of information. In the screenshot above you can even see that the console captured the fact that a screenshot was being taken! We need to cut down this torrent of data so that only output from Panorama X is shown. Start by typing PanoramaX into the search box and pressing Return.
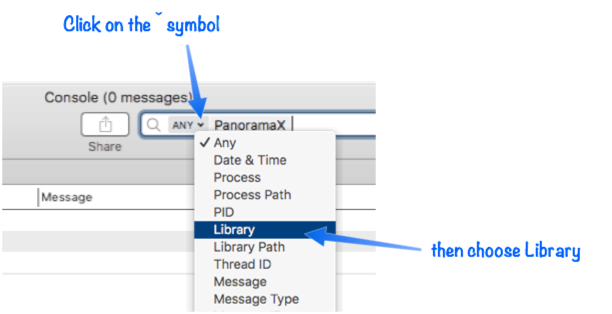
This will still show too much information, because in addition to the instrumentation it will also show internal macOS messages related to Panorama. To fix, this, click on the ˇ symbol, then choose Library from the pop-up menu.
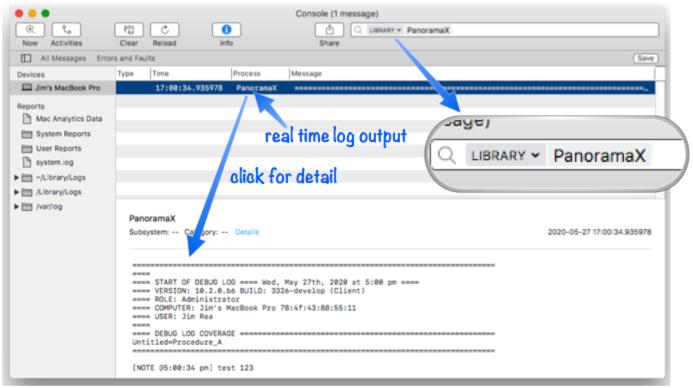
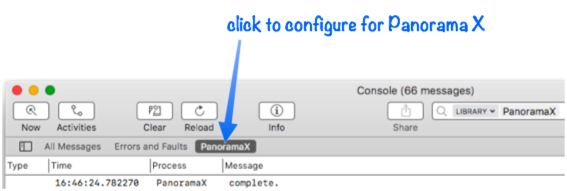
When you’re finished, the Console window should look like this.
Since you’ll probably want to use this configuration again, you should save it. To do that, click the Save button on the right, just below the tool bar.
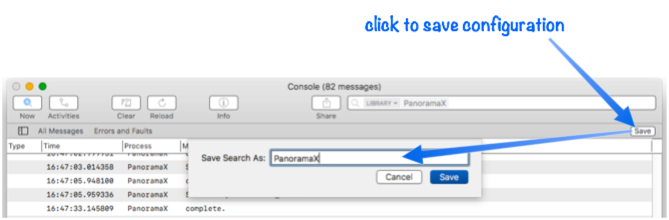
We suggest saving the configuration using the name PanoramaX. After you press the Save button, the saved configuration will appear in bar immediately below the tool bar. Now any time you open the Console window, you just have to click this button to prepare for viewing output from Panorama. (You can also choose this option from the Action menu.)
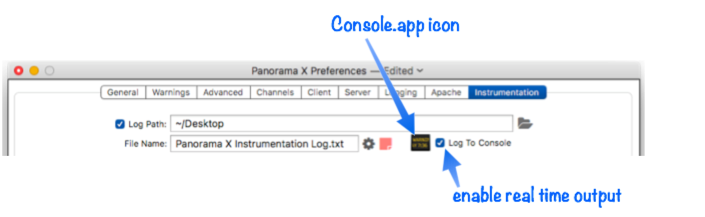
Once the Console app is running open you’ll see the Console.app icon in the Instrumentation panel (in the Preferences window). Click the Log to Console checkbox to enable real time output (you can also select this option in the Instrumentation menu).
Now you’re all set, when you run code that contains instrumentation, the log output will immediately appear in the Console window.
Note: If you open the Console app after opening the Instrumentation panel, Panorama will automatically detect it and the icon will appear. In other words, you can open the Console app before or after opening the Instrumentation panel.
Viewing Instrumentation with Terminal.app
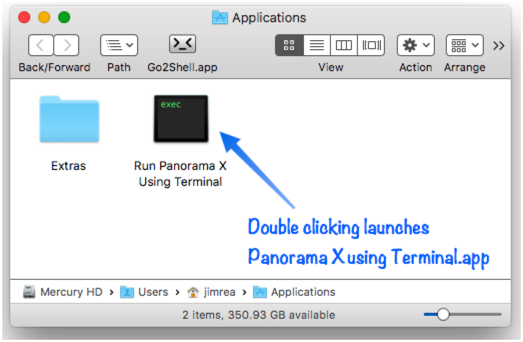
Using Terminal.app for crash proof instrumentation monitoring of Panorama X instrumentation also requires a slight bit of prep. The first step is to open the Preferences window. Then choose the Install “Run Panorama X using Terminal.app” command from the Install menu. This will create a new icon inside the Applications folder inside your user folder.
Note that this is not your primary Applications folder, but your alternate Applications folder that is inside your user folder. Panorama will open this folder for you when it creates the file, so it should be easy to find. Once it is created you can use it in place, or you can move it to another location (including the primary Applications folder), and you can install it in the dock if you want. You can also rename it if you wish.
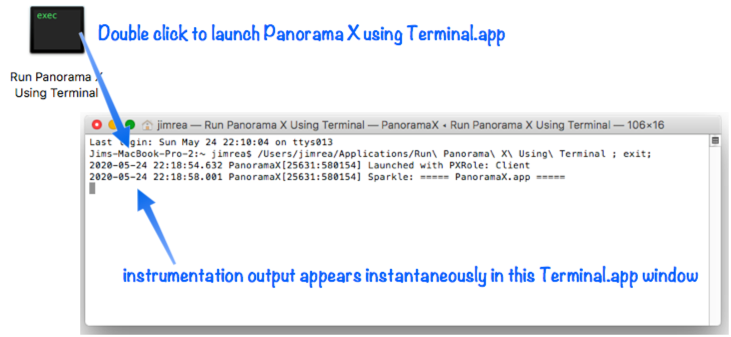
To view realtime Panorama instrumentation using Terminal.app, first quit Panorama if it is currently open. Then double click the Run Panorama X Using Terminal icon (or single click if it is in the dock). This will launch Terminal.app, or open a new terminal window if Terminal.app is already open. Then Panorama X will launch from this terminal window.
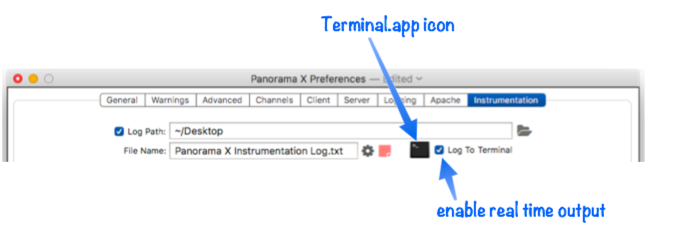
When you open Panorama this way, you’ll see the icon for Terminal.app in the Instrumentation panel. Make sure that Log To Terminal is checked to enable real time output to the terminal window (you can also select this option in the Instrumentation menu).
Now you’re all set, when you run code that contains instrumentation, the log output will immediately appear in the Terminal window. A nice aspect of this approach is that you can easily select and copy multiple lines of the log text.
Note: You must leave Terminal.app running with this window open for as long as Panorama itself is running. If you close this terminal window, or quit the Terminal application, Panorama will immediately stop running.
Note: You cannot drag a database onto the Run Panorama X Using Terminal icon to open the database. Instead, you must first double click on the Run Panorama X Using Terminal icon to launch Terminal and Panorama, then drag the database icon onto the Panorama icon in the dock (or simply double click on the database idon).
Viewing Instrumentation with Xcode
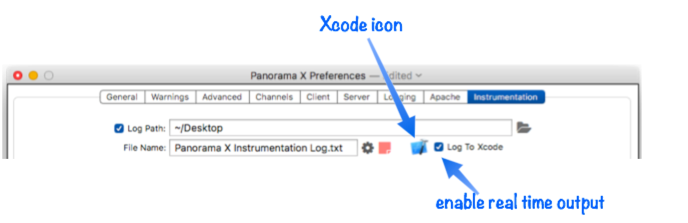
If you launch Panorama with Xcode, you’ll see the Xcode icon in the Instrumentation panel and all instrumentation output will go to Xcode’s console window.
Sorry, this is just a tease. You can’t launch Panorama with Xcode unless you work here at ProVUE Development. But we use this technique all the time, so we thought we’d give you a peek.
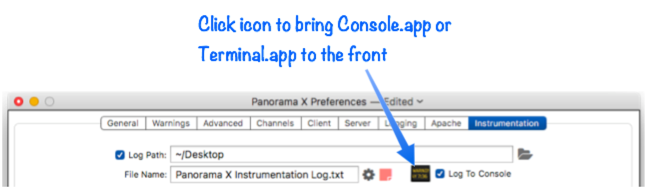
Bringing Console.app or Terminal.app to the Front A quick way to bring the app you are using to view instrumentation output to the front is to click on the icon. You can also use the Instrumentation menu, which will contain a Bring Console to Front or Bring Terminal to Front item, depending on which you are using. (Of course you can also use regular macOS methods to bring the app to the front, for example clicking on its dock icon or pressing Command-Tab.)
Note: If you are running Panorama X under Terminal.app, it doesn’t matter whether Console.app is running or not – the output will go to Terminal.app. There is no way to make the output go to both Console.app and Terminal.app at the same time.
Testing the Instrumentation Output
To verify that the instrument output is configured correctly, you can click on the Instrumentation Note icon (or choose Instrumentation Note from the Instrumentation menu. This opens a dialog that allows you to send anything you want to the log.
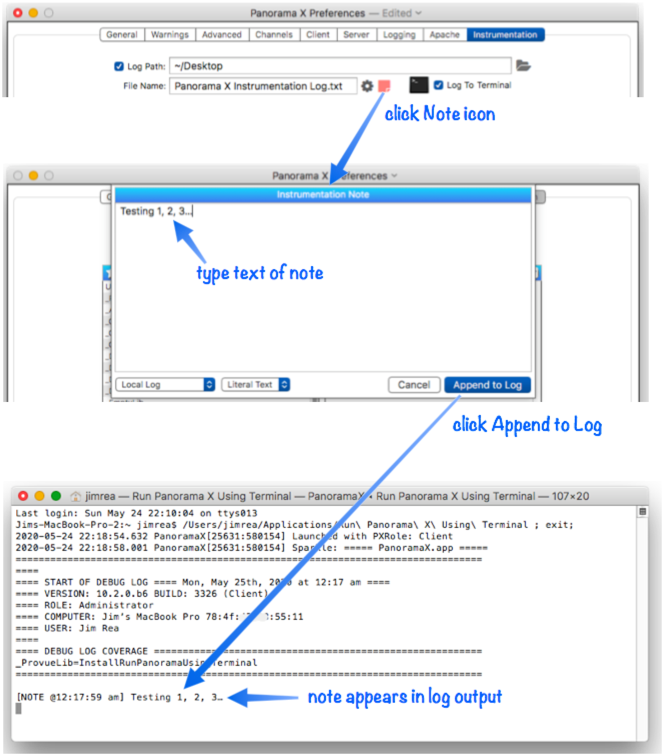
In the example above Panorama has been configured to send the instrumentation output to Terminal.app. If you’ve configured it to send the log to Console.app, you’ll see the note output there.
See Also
- Client/Server Debug Instrumentation -- using instrumentation with Panorama X server and clients.
- Coding with Debug Instrumentation -- modifying your code to generate debug instrumentation output.
- Customizing Debug Instrumentation Coverage -- specifying what code is being debugged at the moment.
- Debug Instrumentation -- conditional logging of the internal state of Panorama program code.
- Debug Instrumentation Log Window -- dynamically monitor debug instrumentation output as your program runs.
- Debug Instrumentation Monitoring using an External Program -- monitoring debug instrumentation with an external program (Terminal.app, BBEdit.app).
- Debug Instrumentation Text File -- configuring and accessing the debug instrumentation log (text) file.
- info("runningunderterminal") -- returns the name of the terminal program if Panorama was launched under one, otherwise it returns empty text.
- labelize( -- returns the value of a field or variable along with a label. This saves typing when you need to display fields or variables when logging and debugging.
- labelizeformula( -- returns the value of a formula along with the formula itself as a label.
- labelizeinfo( -- returns the value of an info( function, along with the function itself as a label.
- labelizepattern( -- formats a text value using a label and a pattern.
- Recording Code Triggers in Debug Instrumentation -- the code triggers option automatically tracks whenever any code is triggered, whether from a menu, a button, or implicitly (for example when data is entered).
- Recording Control Flow in Debug Instrumentation -- configure debug instrumentation to automatically log when control flow is non-linear, for example a call, return, goto, etc.
- setzlog -- turns instrumentation coverage on or off for a specific procedure (or all procedures within a database).
- zlog -- outputs a message to the instrumentation log (if instrumentation is enabled).
- zlogalways -- unconditionally outputs a message to the instrumentation log.
- zlogcoverage -- allows instrumentation coverage to be turned on or off within a procedure.
- zlogdictionary -- outputs a data dictionary to the instrumentation log (if instrumentation is enabled).
- zlogging( -- returns true if zlogging is enabled for the current database and procedure, otherwise false.
History
| Version | Status | Notes |
| 10.2 | New | New in this version. |