The Preferences>Logging panel allows you to specify what server activities should be recorded for possible later analysis. Normally the logged activities are saved in text files for later review, but you can also request that this activity be displayed in a terminal window. This illustration shows this panel set with all logging enabled.
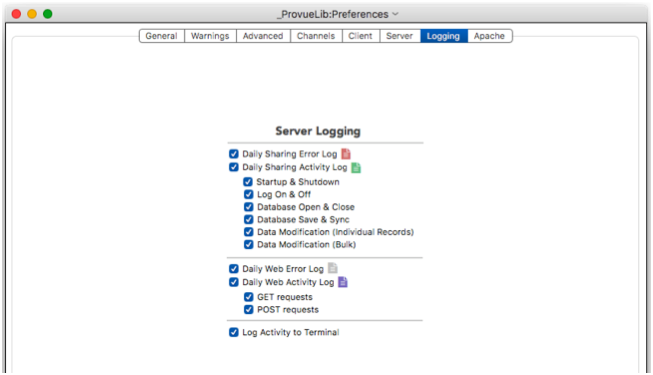
Note: Logging can affect the performance of the server, so you probably don’t want to leave all logging options enabled for routine operation.
Log Files
Panorama X can generate five different daily log files:
- Sharing Activity
- Sharing Errors
- Web Activity
- Web Errors
- Web Performance
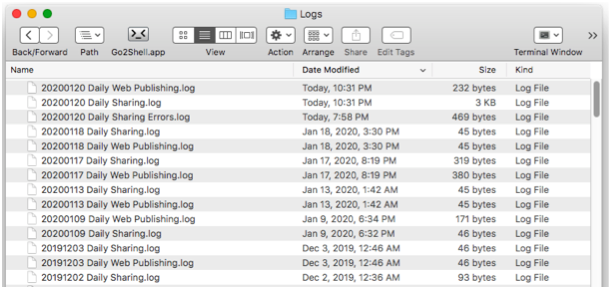
These files are kept inside the Application Support folder on the server. Panorama Server creates new log files each day.
The Sharing Activity log will contain a record of activities that occur as databases are shared, including users logging on and off the server, opening and closing databases, and modifying data.
The Sharing Errors log will keep a record of any errors that occur while databases are shared. Hopefully there won’t be any errors and this log will always be empty, but if you do run into problems, the contents of this log may help with diagnosis.
The Web Activity log keeps a record of every URL that is submitted to Panorama Server from a browser. Only the end of the URL is kept, since the domain name and cgi prefix will be the same for every request. If any form items are submitted with the URL, the data in those items will also be logged.
The Web Errors log keeps a record of any errors that occur when handling web requests from browsers.
The Web Performance log is similar to the Web Activity log, but it also includes the number of milliseconds used to generate the response. This log is tab delimited so that it can easily be imported into a Panorama database for detailed analysis.
Viewing and Manipulating Logs
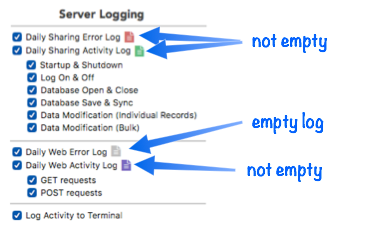
In the Preferences>Logging panel, each of the four logs has an icon next to it. If the log contains anything, this icon will be colored. If the log is empty, the icon will be gray.
When you click on a log icon a popup menu appears.
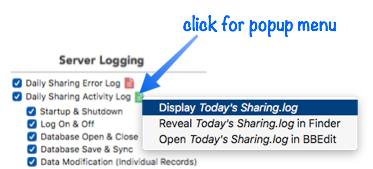
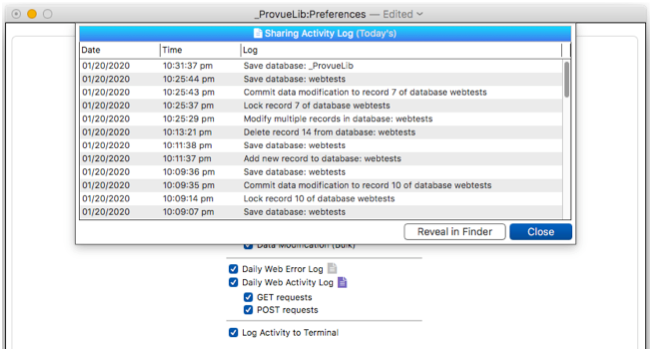
For a quick view of the most recent log entries, choose the Display option. This will display the most recent 100 entries in a dialog sheet, with the most recent entries at the top.
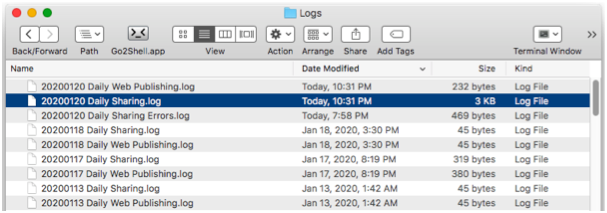
To access the log folder, choose Reveal in Finder. This will open a new Finder window with the specified log file selected for you. You can open it in the text editor of your choice, delete it, whatever you want. You can also access older logs in the folder (from within Panorama you can only directly access the most recent log).
If you have a copy of the BBEdit text editor installed, you can open the log directly in BBEdit from the popup menu. In BBEdit, the entire log for the day will be displayed, not just the most recent 100 items. Also, in BBEdit the most recent entries will appear at the bottom of the log, not the top.
Logged Activities
You may be interested in some activities but not others. The Preferences>Logging panel allows you a limited degree of customization as to what activities are logged. Keep in mind that recording more detail can adversely affect the performance of the server. For best performance, we recommend not logging Data Modification (the last two sharing options).
You can change which activities are logged at any time. If the server is already running, the changes will take effect immediately.
Writing Custom Log Entries
You can create your own custom log entries in a web procedure. Simply use the serverlog statement to write anything you want into the web activity log.
serverlog "Starting my web procedure"
cgiHTML = "..."
serverlog "Finished my web procedure, "+
    info("selected")+" records selected"
Whenever the procedure runs, your text will be output to the log (but only if Web Activity and GET requests are enabled).
Log Caching
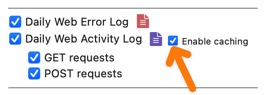
The server normally writes log entries to the disk immediately. This ensures that the log will always be up-to-date even in the unlikely event of a server power failure or crash. However, if you have enabled a lot of log options, writing all entries immediately can slow the server down. For better performance, check the Enable caching option. (This option is only available for Activity logs, Error log entries are always written immediately.)
When the Enable caching option is turned on, log entries are saved in a RAM cache instead of being written immediately to disk. The log entries will be saved to disk when:
- The cache is full (20,000 characters)
- Panorama X Server is shut down
- You click on the pop-up menu to display, reveal or open the log.
The Enable caching option is a good way to go if you’re concerned about performance and not concerned about losing log entries if there is a power failure or crash.
Live Logging to Terminal.app
In addition to (or instead of) recording entries in log files, activity entries can also be output to the console if you are running Panorama Server using Terminal.app. This allows you to see the activity entries immediately, in real time (including your own custom log entries, if you’ve coded them). To learn how to do this, see Launch using Terminal.app in Advanced Server Settings. Note that there can be a performance impact to enabling this option.
Web Performance Analysis
The Web Performance log is designed to help you optimize the performance of your web procedures. Using this log you can track down procedures that are taking longer to run than you expect. So that the performance log itself doesn’t bog down the server speed, this log is always cached (which means that some performance log information may be lost if the there is a power failure or server crash).
Unlike the other logs, the performance log is tab delimited so that it can easily be imported into a database for further analysis. The tab delimited fields in the log are:
- Date: This data is always in MM/DD/YYYY format.
- Time: This is in 12 hour format, hh:mm:ss am/pm.
- Milliseconds: The amount of time taken to generate the HTML response. For example, if the code ran for 1 second, this field would contain 1000.
- Database: The name of the database specified in the URL.
- Procedure: The name of the procedure specified in the URL.
- Request Method: Either GET or POST.
- Detail: Additional detail about the request. Normally this is the extra CGI parameters passed on the end of the URL (if any), but the CGI code can customize the detail field by modifying the cgiActionDetail variable (see below).
Viewing/Importing the Performance Log
Remember, this log is cached, so the log file isn’t always up-to-date. To make sure the performance log information is flushed to the disk, click on the page icon and use the pop-up menu to display, reveal or open the log in BBEdit. You should do this every time before you view or import today’s performance log (of course this is not necessary when working with logs from previous days).
Customizing the Detail Field
A web procedure can customize the detail field by modifying the global cgiActionDetail variable. For example, if a procedure uses a POST field to perform different actions, you might want to include the action name in the log. This would allow you to analyze the performance of each different action separately. Here’s an example of how this could be done.
let action = webformitemvalue("Action")
letglobal cgiActionDetail = action
if action = "ADD"
    ...
elseif action = "DELETE"
    ...
elseif action = "REPORT"
    ...
Programatically Accessing Log Data
You may want to access the log data in a program for further analysis. Since the log data is kept in standard text files any programming language could be used for this (for example Python or even Excel), but this data can also be easily accessed from Panorama using the getserverlog statement or the getserverlog( function (but only from the server computer itself).
Here is an example of a database set up for analysis of web performance log information. It has seven fields, corresponding to the fields saved in the performance log, and a procedure that automatically retrieves the last three days of web performance information and imports it into the database.
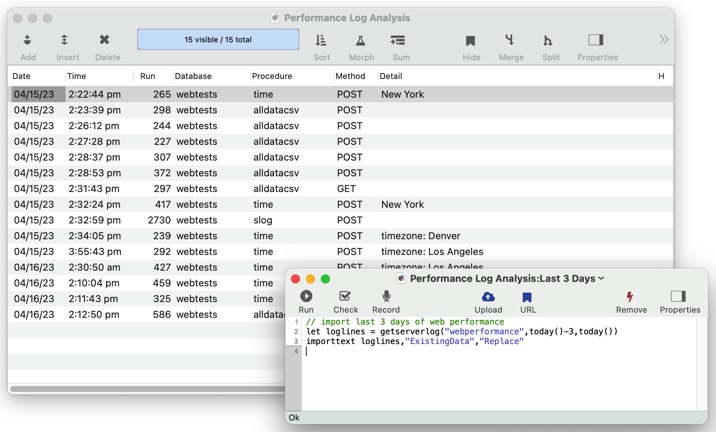
Once imported, the performance data can be sorted, selected and analyzed using all of Panorama’s available tools. See the getserverlog statement or the getserverlog( function to learn more.
See Also
- Advanced Server Settings -- Panorama X Server settings for advanced users.
- Client/Server Debug Instrumentation -- using instrumentation with Panorama X server and clients.
- Installing and Launching Panorama Server -- instructions for getting Panorama Server up and running, as well as best practices for configuring system settings on a server computer.
- Restricting Server Access -- limiting Panorama X Server access to authorized users.
- Server Administration Wizard -- this wizard is used to monitor the operation of Panorama servers (both local and remote servers can be monitored), including monitoring server status, checking database status and downloading databases, and monitoring the status of user sessions.
- Setting up a Computer as a Panorama X Client -- instructions for setting up a new client computer so that it can access a Panorama X server.
- Using an External Web Server -- instructions for using Panorama Server in conjunction with an external web server (for example Apache, Nginx, etc.).
History
| Version | Status | Notes |
| 10.2 | New | New in this version. |