Previous: 304: Selecting Data
To display the grand total of all the checks in the database, simply right click anywhere in the Debit field and choose Column Stats. A small pop-up window displays the total, along with other information about the values in this field.
If only a subset of records is selected then the statistics will reflect that subset. For example, if only records from July are selected then the total will include only checks from July.
Summary Workshop
The Summary Workshop wizard is a tool for quickly summarizing, analyzing and charting large amounts of data. The workshop can rapidly categorize the information in a database and calculate totals, averages, counts, minimum/maximums and standard deviation.
Opening the Summary Workshop
To open the Summary Workshop, click on the Summary tool and choose Summary Table & Chart from the pop-up menu.
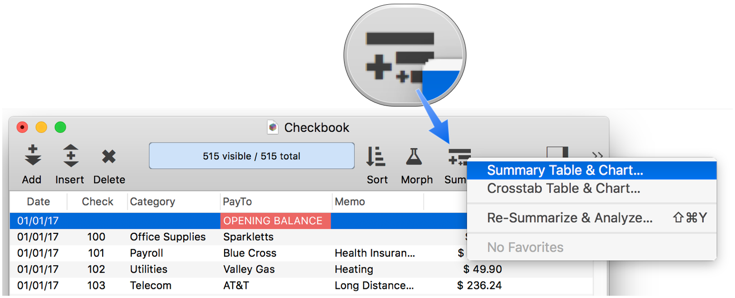
You can also open the Summary Workshop from the menu bar by choosing Field>Analyze>Summary Table & Chart.
Summary Groups
Use the Group by pop-up menu to specify how the database should be divided into groups. This menu lists all the non-numeric fields in the database. If a field contains dates, you are given the option to group by different calendar periods (month, quarter, year, etc.)
Summary Computations
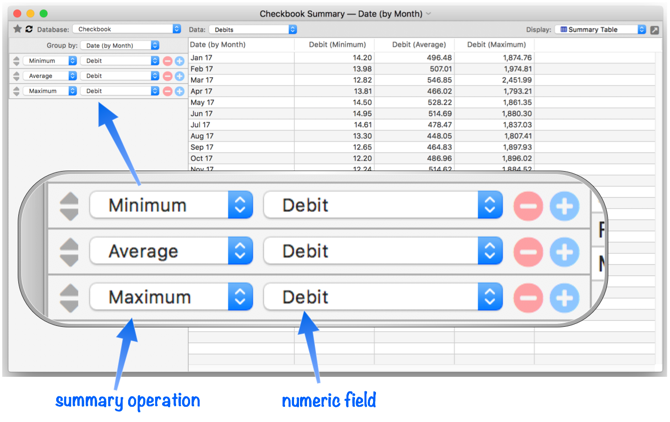
To specify what computations should be performed, use the popup menus in the computation settings panel. Specify an operation and numeric field for each column in the summary workshop.
Revealing the Underlying Data
To reveal the underlying raw data behind any summary row, simply right click on the row and choose Select Original Data.
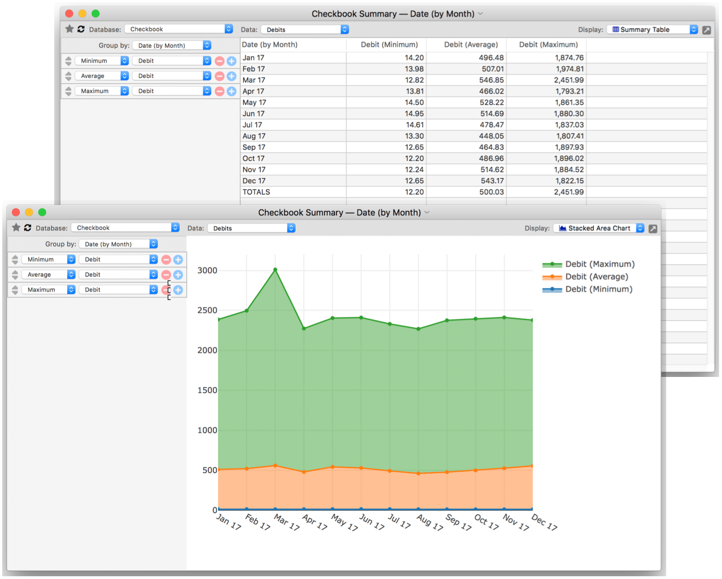
Summary Chart Display
In addition to tabular display, the Summary Workshop can also display various kinds of charts. Simply choose the type of chart you want to see from the Display popup menu.
The charts are interactive – when you hover over them a label appears showing the data value.
Crosstab Workshop
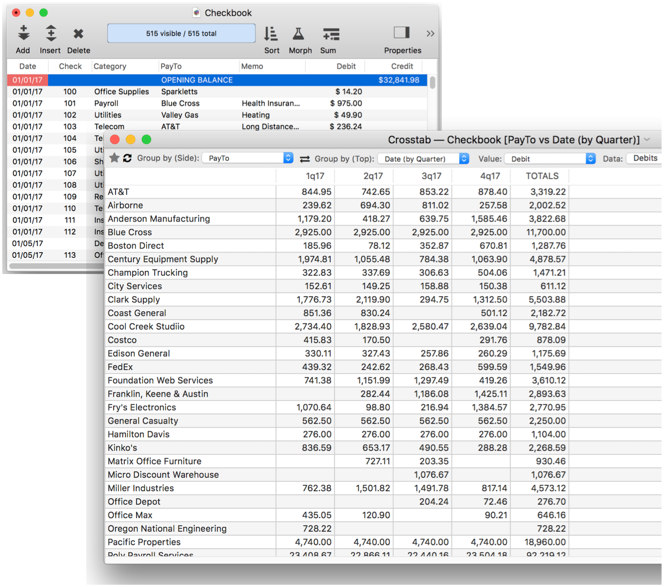
The Crosstab Workshop wizard is a tool for two dimensional summarizing, analyzing and charting large amounts of data. The workshop displays a two dimensional grid summarizing the information in a database by multiple categories, for example spending by vendor vs. quarter, as shown here:
Opening the Crosstab Workshop
To open the Crosstab Workshop, click on the Summary tool and choose Crosstab Table & Chart from the pop-up menu.
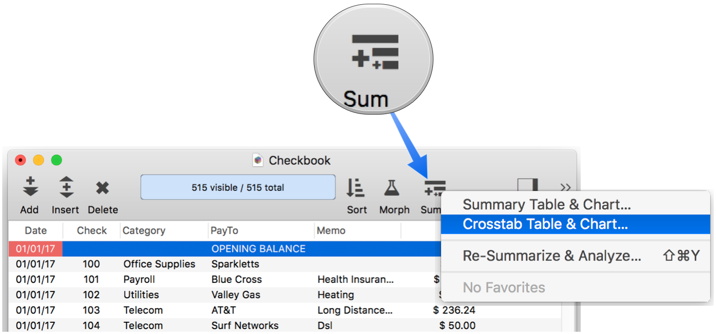
You can also open the Crosstab Workshop from the menu bar by choosing Field>Analyze>Crosstab Table & Chart.
Crosstab Groups
Use the Group by (Side) and Group by (Top) pop-up menus to specify how the database should be divided into groups. This menu lists all the non-numeric fields in the database. If a field contains dates, you are given the option to group by different calendar periods (month, quarter, year, etc.)
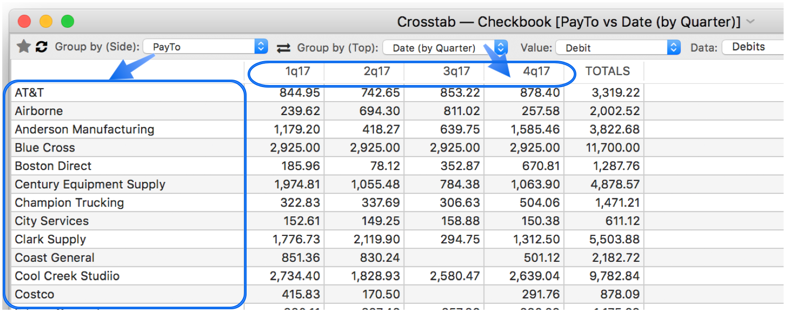
When you change either of these pop-ups, the crosstab summary updates immediately.
Crosstab Computations
Use the Value pop-up menu to choose whether the crosstab body contains counts or totals. If totals, you will need to choose which field will be included in the total.
Revealing the Underlying Data
To reveal the underlying raw data behind any crosstab cell, simply right click on the cell and choose Select Original Data.
Crosstab Chart Display
In addition to tabular display, the Crosstab Workshop can also display various kinds of charts. Simply choose the type of chart you want to see from the Display popup menu.
Next: 306: Collapsible Outline Summaries
See Also
- Crosstab Workshop -- tool for two dimensional summarizing, analyzing and charting large amounts of data.
- Selecting with the Context Menu -- searching for information related to the current cell.
- Summary Workshop -- tool for quickly summarizing, analyzing and charting large amounts of data.
History
| Version | Status | Notes |
| 10.0 | Updated | Carried over from Panorama 6.0, with updates. |