Previous: 305: Totals, Summaries and Charts
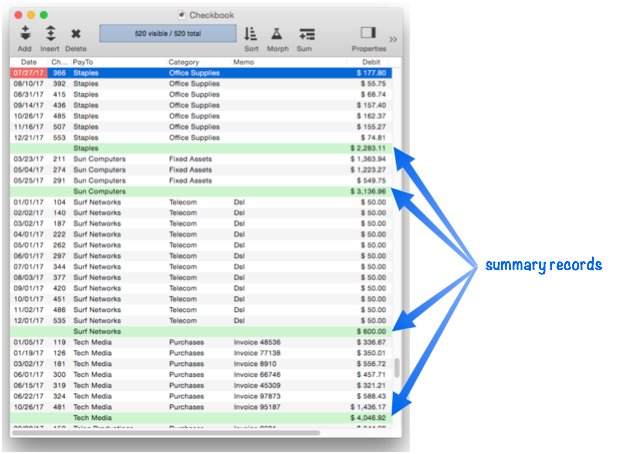
In addition to the Summary Workshop and Crosstab Workshop wizards described in the previous lesson, Panorama also has a system for embedding summary information into the database itself, into special records called Summary Records. Summary records are temporary records used for calculating totals, subtotals, and other summary information. You don’t create summary records yourself, instead, Panorama automatically creates them for you when you tell it to divide the database into groups. When viewing the database as a sheet you can identify summary records by the light green background color.
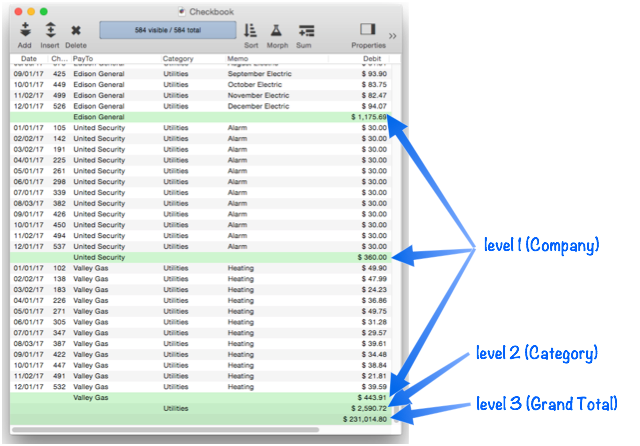
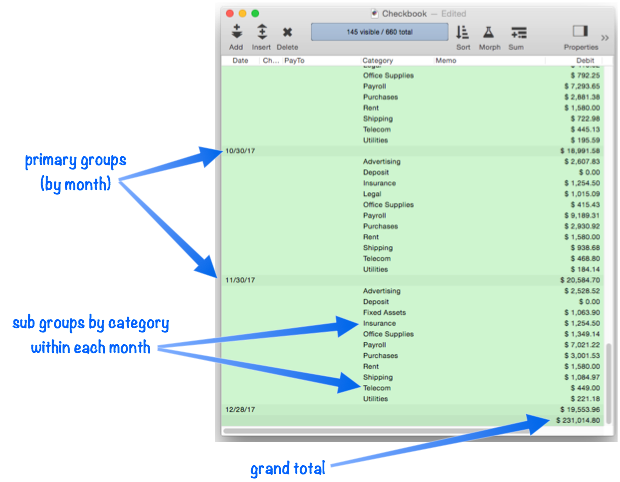
Summary records may be created in up to seven levels, from 1 to 7. Each higher level is used for a higher level of subtotal. Each summary level can be identified by the deeper shade of green in the background, as shown here. This database has been grouped into two summary levels (plus the grand total).
As you’ll see in a few minutes, Panorama allows you to treat summary records as a collapsible outline. You can also expand and collapse individual sections of the outline to reveal specific details or to get a “birds-eye” view of the data.
Summary records are designed to have a very short lifetime—usually only a few minutes. When you want to calculate subtotals or other summaries you‘ll create new summary records. After you’ve examined (and possibly printed) the summaries, you’ll use the Remove Summaries command to remove them so you can get back to regular work with your database (see Deleting All Summary Records).
Summarize & Analyze Dialog
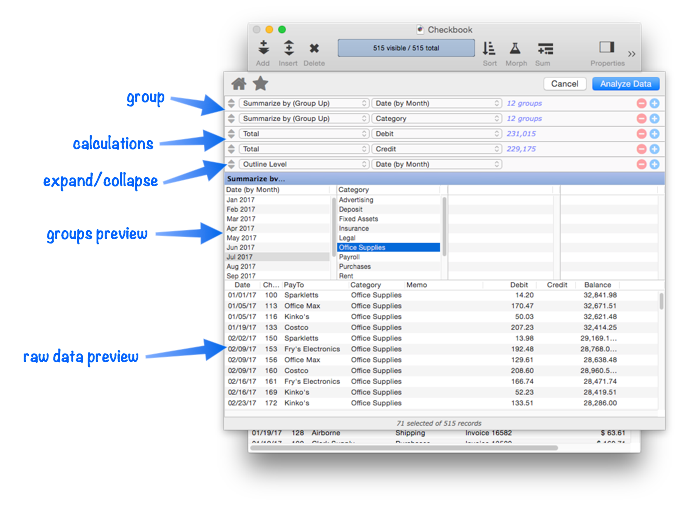
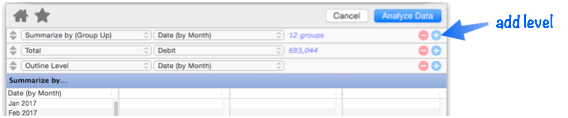
The Summarize & Analyze Dialog is a one-stop dialog for creating and filling in summary records based on pre-selected criteria. In the dialog you specify how you want the database to be divided into groups, what calculations you want performed, and what level of detail you want to see. Once set up, press one button and all the necessary operations are performed. (You can also perform these operations as separate steps, see Generating Summaries Manually). Here is the basic layout of this dialog.
Single Level Analysis
This dialog looks complicated, but to perform a single level analysis all you have to do is choose the field you want to divide into groups, and the field you want to total. Then simply press the Analyze Data button and all of the Summary Records will be created and filled in for you, and the summary outline collapsed to hide the raw detail and show only the summaries (see Expanding and Collapsing the Summary Outline).
Multi Level Analysis
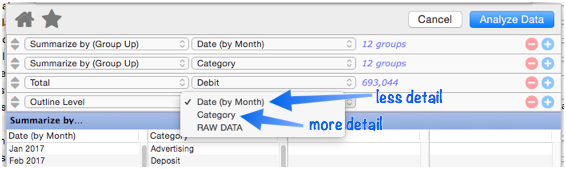
Panorama can create up to seven nested summary levels, for example Categories within Months, or Cities within States within Months within Years. To add an additional summary level, re-open the Summarize & Analyze dialog, then press the + button on the first row to add a second summary level.
Once the row is added, select the field you want to sub-group by.
You’ll also now have the choice of what level of summary to display by default. (Of course you can always expand and collapse the summary outline later, see Expanding and Collapsing the Summary Outline). In this example, the primary summary is by month, with the categories grouped within each month.
Press the Analyze Data button to create the multi-level summary outline.
Expanding and Collapsing the Summary Outline
A unique feature of Panorama is that summaries aren’t just static on a report, they can be dynamically expanded or collapsed to show more or less detail. You can “zoom out” to look for major trends, then “zoom in” to examine specific details. We call this collapsing (zoom out) and expanding (zoom in). To expand a particular summary, click on the summary, then click on the Sum tool and choose Expand One Level of Detail from the pop-up menu. If the database has more than one summary level you can repeat the process all the way down to the raw data. To collapse a summary, click on it and then click on the Sum tool. Or, right click and choose Collapse Underlying Detail.
Expanding and Collapsing the Overall Summary Outline
In the previous section you learned how to collapse and expand individual summary records. Sometimes, however, you’ll want to expand or collapse the entire database as a whole. Use the Outline Level commands to do this. If you choose RAW DATA then everything will be visible — the original data, and all summary records. If you choose GRAND TOTAL then only one record will be visible — the grand total summary record. The choices in between will display varying levels of summary detail.
Using the Context Menu to Expand/Collapse
In addition to expanding and collapsing from the Sum tool, you can also expand and collapse by right clicking on a summary record and choosing these commands from the pop-up menu (you can right click on any cell in the line). If you are using a trackpad you can click with two fingers to access the pop-up menu. This is my favorite way to access these operations because you can select the record and expand/collapse all in one spot.
The expand/collapse operations are also available from the menu bar in the Field>Analyze submenu. Note: These operations only appear in the menus if there are actually summary records in the database – if there aren’t any summary records, the expand/collapse items are omitted from the menus.
Getting Rid of Summary Records
Summary records are designed to have a very short lifetime—usually only a few minutes. When you’re finished with summary records, you can simply choose Field->Analyze->Remove All Summaries to get rid of them. All of the summary records will disappear, and you can get back to working with your original data. This command is also available when clicking the Sum tool and when right-clicking on any cell in the data sheet.
Ranking Summaries
Panorama normally generates summaries in alphabetical order. By adding an extra rule to the Summarize & Analyze dialog you can tell Panorama to rank the summaries by value. For example, if you are summarizing by month they could be ranked to show the month with the highest sales (or spending, etc.) first, then the second highest etc. Start by clicking on the + button in the outline level row of the dialog.
Panorama assumes that you want to rank by the field that is being totalled in this analysis (in this case Debit), but you can choose another field if you wish, or you can switch to Sort Up if you want to rank in ascending order (low to high) instead of descending (high to low).
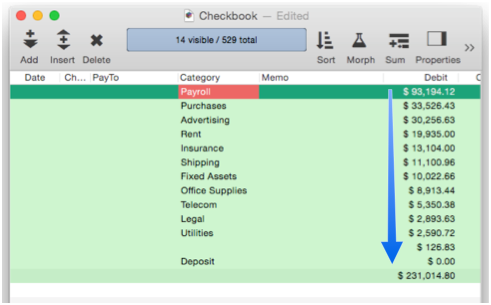
Press the Analyze Data button to see the ranked summaries. Instead of the categories being sorted in alphabetical order, they are sorted by amount.
For multi-level nested summaries you can use the outline level pop-up menu to pick which level is ranked. Whatever level you specified will be ranked. In this example, the category summaries are ranked within each month.
Ranking the summaries doesn’t affect the ability to expand detail. For example, now that the summaries are ranked we can easily see that the purchasing category in May and June was a bit higher than usual. To find out why, right click on the record and expand it (see Expanding and Collapsing the Summary Outline).
The ability to “zoom” in and out like this is a great tool for actually understanding your data.
You can also rank summaries manually, see Ranking Summaries.
Next: 999: Further Reading
See Also
- Deleting All Summary Records -- when finished with summary records, they must be deleted.
- Expanding and Collapsing the Summary Outline -- to see more or less detail.
- Generating Summaries Manually -- manually generating summary records in 3 steps (Group, Calculate, Outline).
- Ranking Summaries -- ranking summary values
- Summarize & Analyze Dialog -- is a one stop dialog for creating and filling in summary records based on pre-selected criteria.
- Summary Records -- are temporary records used for calculating totals, subtotals, and other summary information.
History
| Version | Status | Notes |
| 10.0 | Updated | Carried over from Panorama 6.0, with updates. |