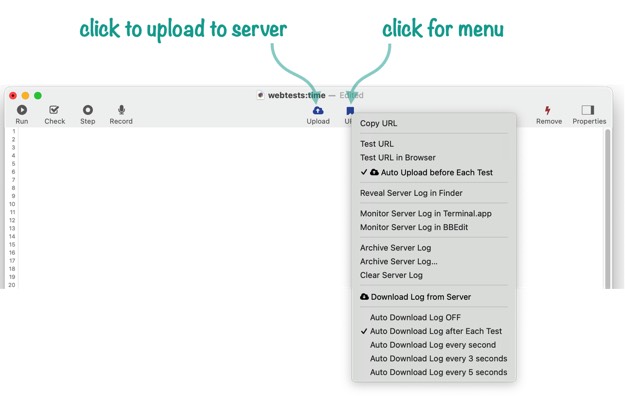
The URL Tool menu is an optional tool that can be added to the toolbar of procedure windows. Clicking on this tool displays a pop-up menu.
Installing the URL Tool
To add this tool, right click on the toolbar of any procedure window, then choose Customize Toolbar from the pop-up menu. Drag the URL tool onto the toolbar (you probably also want to drag the Upload tool into the toolbar). Once added, the URL tool will appear in all procedure windows unless you customize the toolbar again.
The Web URL
Every procedure in a web database has a URL associated with it that can be used to trigger the procedure on the server. This link must be formatted in a particular arrangement, as shown in this diagram.
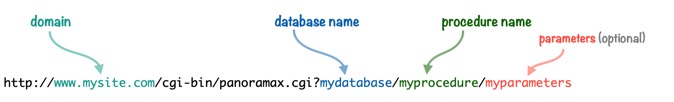
For example, if you have a server www.acme.org with a database named Accounts that has a procedure named Activity, this procedure can be actived from a web browser by typing in the URL:
http://www.acme.org/cgi-bin/panoramax.cgi?Accounts/Activity
To save typing, Panorama can generate this URL for you automatically. Just click on the URL tool and choose Copy URL to copy the URL for the current procedure to the clipboard. Then you can paste the URL into a web browser to trigger the procedure on the server. (Make sure you have uploaded the procedure to the server before you trigger it, of course. You can do that with the Upload tool mentioned earler.)
Web URL Parameters
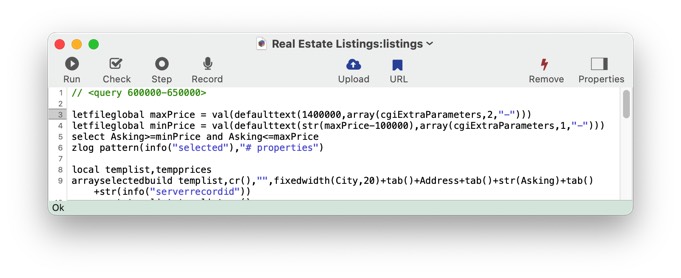
The URL can also include additional parameters that the procedure can examine to modify its behavior. For example, here is a procedure that displays listings from a real estate database. The procedure extracts the minimum and maximum prices to list from the parameter.
For example, this URL would list homes from $500k to $600k:
http://www.acme.org/cgi-bin/panoramax.cgi?Real%20Estate%20Listings/listings/500000-600000
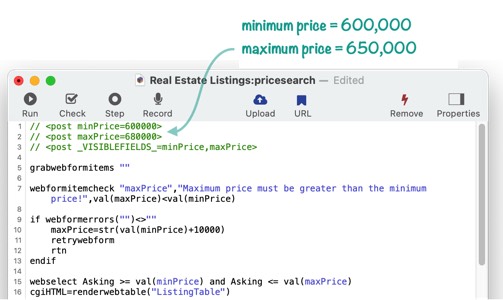
You can type in the parameters manually, but for testing, you can also embed the parameter into a comment in the procedure. In fact, the screen shot above shows this. The <query> tag on the first line specifies the parameter text that should be included in the URL when you copy or test. This ability to pre-define the parameter text is especially handy when using the test feature described later on this page. With the query tag shown in the screenshot above, the URL generated by the Copy and Test commands will automatically include the correct parameter text to display homes between $600k and $650k.
http://www.acme.org/cgi-bin/panoramax.cgi?Real%20Estate%20Listings/listings/600000-650000
Of course you can edit the tag in the code to test with different values, as you’ll see in a moment.
Alternate Domain
The URL menu normally sets the domain automatically when a URL is generated (based on the sharing configuration of the database). Sometimes, however, you’ll want to test with a different domain. For example, suppose you have set up Apache on your local computer, and you want to test your web procedures using Apache. To do that, you’ll need to use http://localhost as the domain, instead of the normal domain. To do that, add a <host> tag to a comment near the top of the procedure, like this:
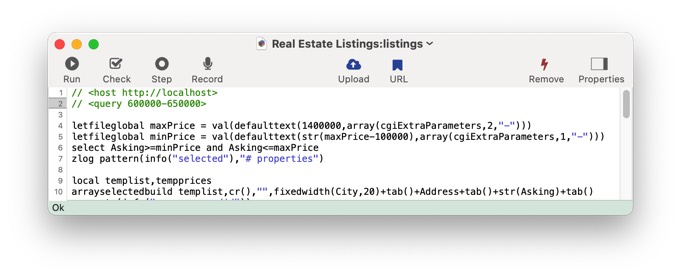
With this tag in place, a URL like this will be generated:
http://localhost/cgi-bin/panoramax.cgi?Real%20Estate%20Listings/listings/600000-650000
URL Separator Character
Panorama normally uses a slash (/) in the URL between the database, procedure names, and extra parameters. However, earlier versions used the ~ character instead. If you wish to use the ~ character, specify that with the <urlseparator> tag.
<urlseparator ~>
CGI Path and name
To change the path to the Panorama CGI, use the <cgipath> tag, for example:
<cgipath cgi-bin/my.cgi>
This only changes the path as far as the test goes. It’s up to you to configure your server so that the path you specify works. If this doesn’t make any sense to. you, just leave the default path of cgi-bin/panoramax.cgi in place.
The URL Test Window
To test a web procedure, click on the URL tool and choose Test URL from the menu. (Make sure you have uploaded the procedure to the server before you test it, of course. You can do that with the Upload tool mentioned earler, or you can configure automatic uploads, described below.)
When you use the Test URL command, Panorama contacts the server and runs the procedure, then it opens the Test window to display the result.
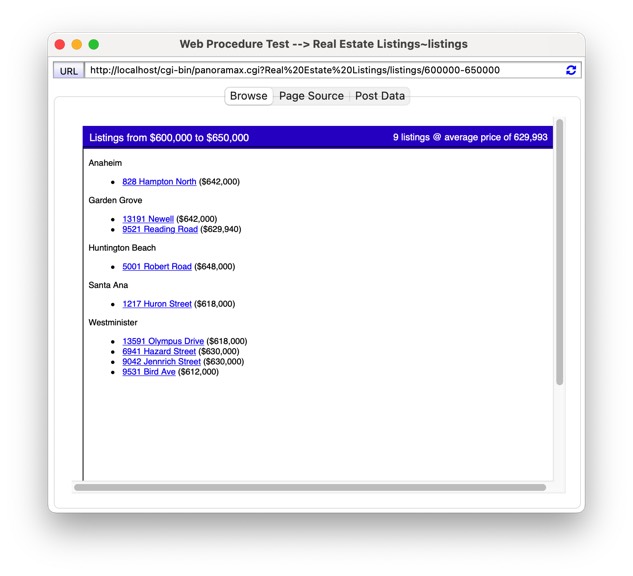
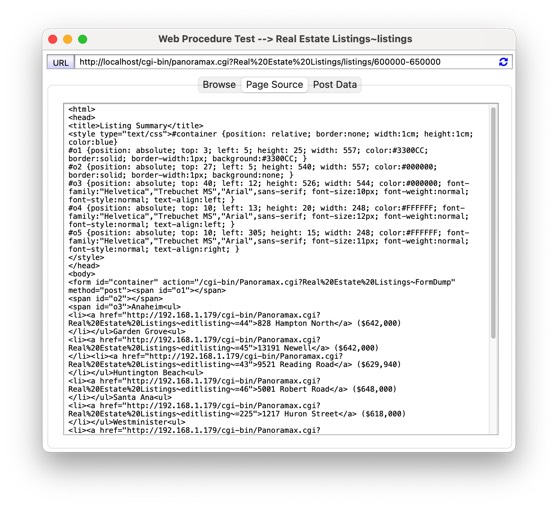
The Test window is basically a limited web browser that is optimized for testing Panorama web procedures. The URL appears at the top, with the web page taking up most of the window. The window is resizable if you need to see more of the web page. Click on the Page Source button to see the underlying HTML code that your web procedure has generated (you can select and copy this code, if needed).
Note: If you want to open the Test window from your own procedure, use the cgitest statement. This statement opens the Test window the same way the URL tool does.
Testing Different Parameter Values
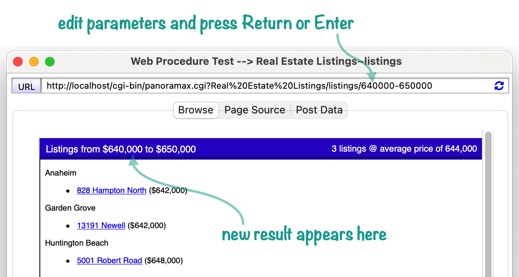
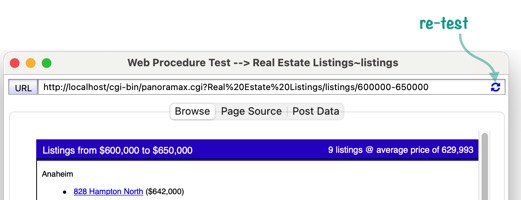
To test a procedure with different parameter values, simply edit the parameters in the URL and press Return or Enter (or click the re-test icon). The procedure will re-run on the server and the new results will be displayed.
Note: You could also go back and edit the <query> tag and re-run the Test URL command, but usually simply editing the URL in the Test window is easier.
Automatically Uploading Code Changes
As you develop and debug web procedures, you’ll be performing these three steps over and over again:
- Modify the code
- Upload the code
- Test the code
To eliminate the second step, enable the Auto Upload before Each Test option.

With this option checked, Panorama will automatically upload the procedure each time you use the Test URL or Test URL in Browser commands. It will also automatically upload each time you click the re-test button in the Test window.
A convenient technique is to leave the test window open as you edit the code. When you’re ready to test again, just bring the test window forward and click on the re-test button to try out the code changes.
Testing POST Data Items (Web Form Items)
Some procedures are designed to process data from a web form. A web form may contain one or more data items (for obscure technical reasons these are also called POST data items). The URL tool allows you to test this type of procedure without an actual form. Instead, you use <post> tags to tell Panorama what form data items you want to simulate. It’s much simpler and faster to test the procedure directly this way rather than having to go thru the hassle of bring up and filling in a form page every time you want to test.
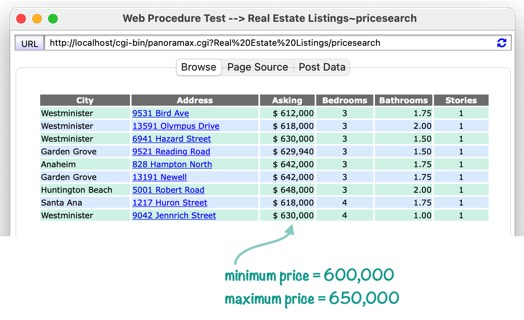
For example, here is a procedure that expects to be triggered by a web form with two data items: minPrice and maxPrice.
Using the Test URL command opens the test window with the results of this procedure, showing only listings within the requested price range.
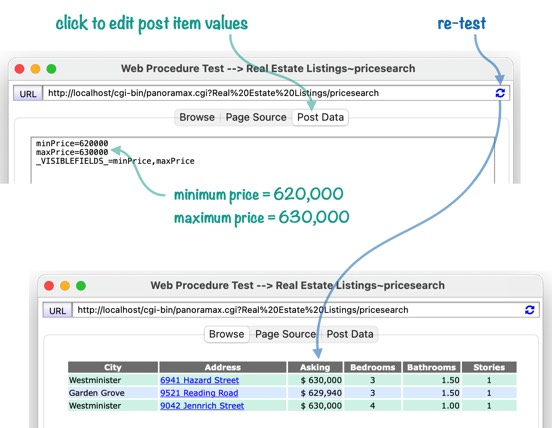
If you want to see what happens when you change the value of one or more data items, you can edit the tags in the code and run the test again, or you can simply switch to the Post Data panel in the test window, edit the values, and then click on the re-test icon.
Testing using a Web Browser
The URL menu also has an option to test the procedure using the default web browser on your computer (usually Safari). This will open the URL in a new window in Safari. Note that when you test with Safari (or any external web browser) any <post> tags in the code will be ignored – there is no way to directly test a procedure with POST items in an external web browser. Instead, you would need to open the correct web form in the external browser, fill in the form items, and use the submit button to test.
Debug Instrumentation
Development and testing of web procedures is complicated by the fact that your code is usually running on a different computer from where you are editing it – possibly in a different room or even thousands of miles away. In addition, the operation of your code is not visible except for the final HTML output. Fortunately, the Debug Instrumentation system can give you a window into the internal operation of your code.
To use debug instrumentation you add one or more zlog statements to your code. Each zlog statement has a formula that you specify. When the code runs, each zlog statement will output the results of its formula to a special text file, called the instrumentation log file. You can examine this log file to see what exactly happened when your code ran on the server. By strategically placing zlog statements throughout your code, you can get a complete view of the control and data flow that your code performed.
When your web procedure code runs, the instrumentation log file is generated on the server computer. Since it may be inconvenient to view the log file on that remote computer, Panorama includes options to manually or automatically transfer the log file to your development computer, where the code is being edited. As described below, you can even dynamically watch the instrumentation in real time on your development computer.
Enabling Debug Instrumentation on the Server Computer
Before you can use debug instrumentation for web procedures you must enable Debug Instrumentation on the server computer. This must be done on the server computer itself, either directly or via a remote VNC session.
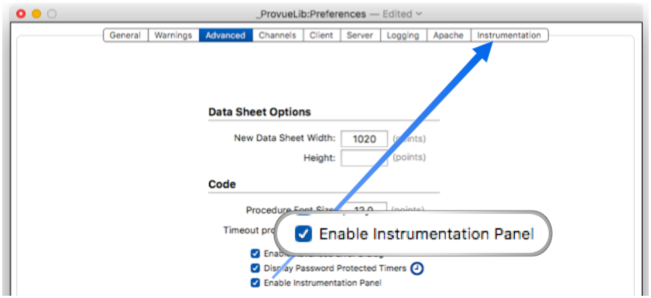
The first step is to enable the Instrumentation panel, which is done by opening the Preferences window (from the Panorama menu), then clicking on the Advanced tab, then clicking the Enable Instrumentation Panel checkbox. You’ll immediately see an additional panel option, Instrumentation.
For remote debugging you must enable instrumentation to output to a text file, so make sure the Log Path box is checked (it’s usually checked by default).
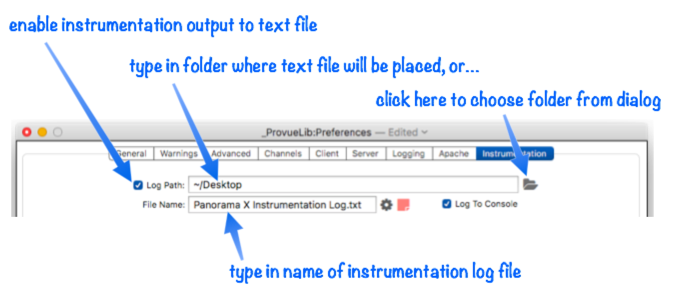
By default, the instrumentation output will be put into a file named Panorama X Instrumentation Log.txt in your desktop folder. You can change both the name and the folder. If you type in a different folder path, Panorama will automatically create the specified folder for you if it doesn’t already exist. For remote debugging you can use any path and name you want. However, you’ll usually not be accessing this file directly, instead you’ll be transferring it to the development computer.
The final step is to make sure that the Enable Coverage for All Open Procedure Windows option is enabled. This option bypasses the necessity of enabling coverage for each individual procedure you are working on, which is difficult to do on the server. Instead, with this option checked the server will automatically enable debug coverage for every web procedure you run. (Note: When you are running web procedures, even procedures that you call as a subroutine will have instrumentation coverage, even if those procedures aren’t currently open on your development computer.)
To make sure that Enable Coverage for All Open Procedures is enabled, click on the star icon in the Instrumentation panel.
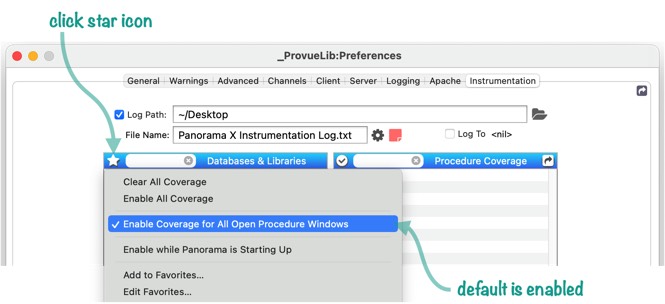
This option is normally enabled by default, but if you’re not seeing instrumentation appear when you expect it, you should check this setting.
Disabling Debug Instrumentation on the Server Computer
There’s a slight performance penalty when debug instrumentation is enabled, so when you finish debugging, it’s usually best to disable instrumentation on the server computer. You can do this by un-checking any of the three options described in the previous section, but the best method is to un-check the Enable Instrumentation Panel checkbox in the Advanced preference panel (this must be done on the server computer). When you want to debug again you can simply re-enable the option again.
Running a Server on the Development Computer
The discussion on this page assumes that the server is running on a remote computer, NOT the same computer you are using for development. However, it is possible to run a server locally on the same computer being used for code editing. In that case, you should ignore all of the dicussion on this page about configuring the debug instrumentation on the server and transferring the instrumentation log from the server to the development computer. Since in this special situation the server and the development computer are the SAME computer, none of this extra work is necessary. Just use the regular single user instrumentation log techniques as described on the Debug Instrumentation page.
Viewing Debug Instrumentation on the Development Computer
The instrumentation log file generated as your web procedure runs is created on the server computer. Since you may not have direct access to the server computer, that could be somewhat inconvenient. It would be much nicer to view the instrumentation output on your local computer, the computer you are using to edit the code. To facilitate this, Panorama can transfer the instrumentation output from your server computer to your local development computer. This is done with the menu commands in the lower section of the URL menu.
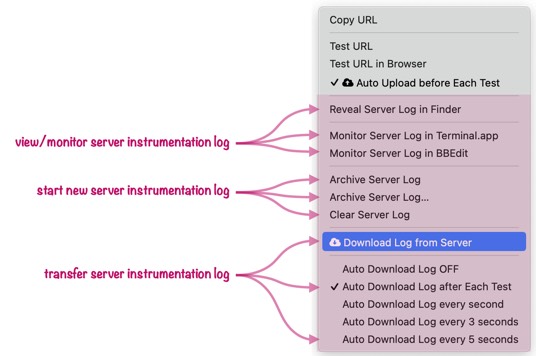
Manual Downloads Use the Download Log from Server command to manually transfer the instrumentation log from the server to your develoopment computer. The transferred log information will be appended to any server log information you’ve previously downloaded. Once the transfer is complete, the log information is deleted from the server.
Automatic Downloads after each Test If you are using the Test URL or Test URL in Browser commands described above, you can configure Panorama to automatically transfer the instrumentation log after each test is performed.
Periodic Downloads If you are testing your web code using an external browser (Safari, Chrome, etc.) then Panorama has no way of knowing when you’ve triggered a web procedure, so it can’t automatically transfer the instrumentation log after each test. In that situation, you can either manually download the log after you run a test, or you can configure Panorama to automatically transfer the log periodically (every 1–5 seconds). The periodic option is nice because the log will automatically update, but you may notice occasional “hiccups” in the Panorama user interface as the log is transferred. Use the less frequent options to minimize this issue.
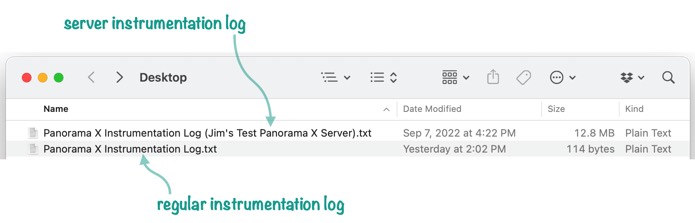
Reveal Server Log in Finder The server log file will be in the same location as your regular instrumentation log file, but with the server name as a suffix. You can use the Reveal Server Log in Finder command to locate this file.
Choose Archive Log to rename the log file and start fresh with a new log file. The existing log file stays in the same folder, but with the date and time appended to the end, for example Panorama X Instrumentation Log (Jim’s Test Server) Archive 2020_05_20_10_32_12.txt. Choose Archive Log… to display a dialog that allows you to choose the name and location of the archived file, instead of having Panorama generate the name automatically.
The final option, Clear Log, clears the server log so you can start fresh. Whatever is currently in the log is permanently lost.
Dynamic Monitoring of Server Instrumentation Activity
You can view the log file after you’ve finished running your program, but in most cases what you really want to do is monitor the instrumentation activity dynamically as it happens. There are two easy ways to do that: 1) using Terminal.app or 2) using BBEdit 14.5 or later.
Dynamic Monitoring via Terminal.app
Terminal.app is a utility program that Apple includes on all macOS computers (so you already have it installed). To start monitoring Panorama instrumentation using Terminal.app, click on the URL menu and choose Monitor Log in Terminal.app.
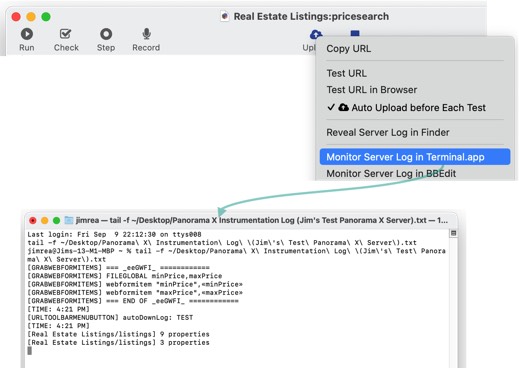
Terminal.app will open with a new window. This new window will show recent Panorama instrumentation activity, and will automatically update as new activity occurs.
(To learn how to modify your code to show instrumentation information, see Adding Code Instrumentation farther down on this page.)
Dynamic monitoring will continue for as long as you leave the Terminal.app window open. You can even quit Panorama and re-open it, and monitoring will continue. When you want to stop dynamic monitoring, close the Terminal.app window:
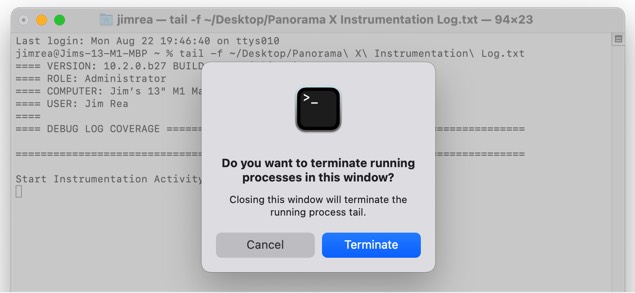
When asked if you want to terminate running processes, press the Terminate button. (Technical note: This will terminate the tail shell command. The tail command is what is actually providing the dynamic monitor.)
If you want to stop dynamic monitoring without closing the Terminal.app window, click on the window and then press Control-C.
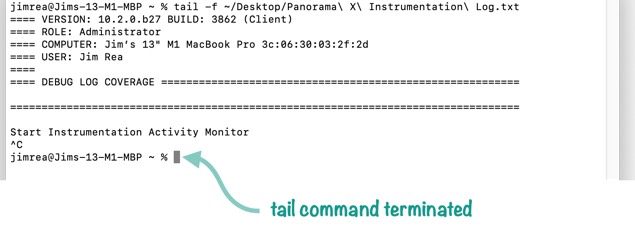
This allows you to continue viewing the instrumentation information, but new information won’t appear.
Dynamic Monitoring via BBEdit
An alternate way to dynamically monitor the instrumentation log is using the BBEdit text editor from Bare Bones Software. BBEdit is a popular text editor program written by Bare Bones software. If you don’t already have a copy of this application, a free version is available on the Mac App Store or directly from the Bare Bones web site (https://www.barebones.com). The free version doesn’t have all of the fancy bells and whistles of the paid version, but it will work for dynamic monitoring of Panorama instrumentation logs. Important: The dynamic monitoring feature only works with BBEdit 14.5 or later.
To start monitoring Panorama instrumentation using BBEdit, click on the URL menu and choose Monitor Log in BBEdit. When you choose this command, BBEdit will open with a new window. (If this doesn’t work, make sure you have BBEdit 14.5 or newer installed on your computer.) This new window will show recent Panorama instrumentation activity, and will automatically update as new activity occurs.
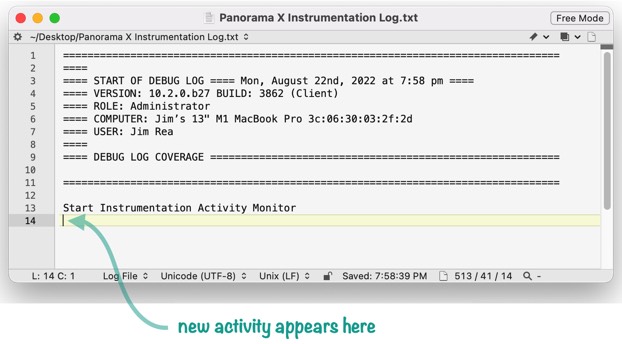
As you can see, this window looks very similar to the same display in the previous section using Terminal.app. So why would you go to the trouble of installing and using BBEdit instead of using Terminal.app? The advantage of BBEdit is that it is a full featured text editor, with powerful searching and other useful features. If your instrumentation logs get large (and they can quickly grow to hundreds of thousand of characters if you are debugging a complex program), BBEdit also has much better performance than Terminal.app for such large amounts of text. It only takes a couple of minutes to install BBEdit, and we think it is well worth it if you plan to use debug instrumentation on a regular basis.
Adding Code Instrumentation
To use instrumentation, you need to put special statements into your code. As the code runs, these statements will output information into the log (assuming the coverage is enabled, as described above).
The primary statement for instrumentation is zlog. This statement has one parameter, a formula.
zlog formula
When the code runs, Panorama calculates the formula and puts the result into the log. So when you look at the log, you can see the result of that formula at that particular instant in time. Here’s an example of a short program with zlog statements added to monitor the progress of the program. I’ve put this into a procedure named Test Loop.
zlog "Start program."
for n,1,5
    zlog n
endloop
zlog "Finished."
If you run this program, the log output will look like this. (Don’t forget to enable the coverage for the procedure. If the coverage is off, the zlog statements will be ignored.) Notice that the start of each line begins with [Test Loop], the name of the procedure. This helps you keep track in the log of what code is running, especially useful in large complicated databases with lots of procedures.
[Test Loop] Start program.
[Test Loop] 1
[Test Loop] 2
[Test Loop] 3
[Test Loop] 4
[Test Loop] 5
[Test Loop] Finished.
Displaying Variables in the Log
It’s very common to display a variable or field in the log. Of course you can construct a formula to do that manually, but there is a function called labelize( that can help make that easier. This function displays not only the value of the variable or field, but its name. Here’s a revised version of the program that uses this function.
zlog "Start program."
for n,1,5
    zlog labelize(n)
endloop
zlog "Finished."
The log output looks very similar, except that now the variable name is displayed as well as the value. If you have a complicated log with pages of output, this can be invaluable.
[Test Loop] Start program.
[Test Loop] n: 1
[Test Loop] n: 2
[Test Loop] n: 3
[Test Loop] n: 4
[Test Loop] n: 5
[Test Loop] Finished.
If the variable contains multiple lines of text, the labelize( function will automatically switch to a multi-line format.
zlog "Start program."
let Address = "1234 Tank Farm Road"+cr()+"Suite 72"+cr()+"San Luis Obispo, CA"
zlog labelize(Address)
Here’s what a multi line value looks like in the log:
[Test] Start program.
[Test] === Address ============
[Test] 1234 Tank Farm Road
[Test] Suite 72
[Test] San Luis Obispo, CA
[Test] === END OF Address ============
By the way, there is no reason you can’t use multiple labelize( functions in one zlog statement, like this.
let dbname = info("databasename")
let fname = info("fieldname")
zlog labelize(fname)+" in "+labelize(dbname)
The log output from this code will look something like this:
[Test] fname: Phone in dbname: Contacts
However, this won’t work if any of the variables or fields contain multiple lines. In that case, you should only use a single labelize( function.
If you don’t like the format the labelize( function uses for the label and data, you can customize it. See labelize( for further information.
Displaying Formulas in the Log
The labelize( function only works with an individual variable or field name. You cannot use it with a general formula. For example, this code won’t work.
zlog labelize(FirstName+" "+LastName))
In fact, it will result in an error that will stop the program. There are three possible solutions. First, you could just set up the required formula yourself.
zlog "Full Name: "+FirstName+" "+LastName
Alternately, you could set up a temporary variable and use that.
let fullname = FirstName+" "+LastName
zlog labelize(fullname)
Finally, you can use the labelizeformula( function, as shown below. Note that the entire formula must be quoted, in this case with curly braces ({ and }).
zlog labelizeformula({FirstName+" "+LastName})
The result will look like this:
[Test] FirstName+" "+LastName --> Mary McCormack
If the formula result contains multiple lines of text, the labelizeformula( function will automatically switch to a multi-line format.
zlog labelizeformula({listfiles(info("desktopfolder"))})
Depending on the contents of your desktop folder, the output will look something like this:
[Test] === listfiles(info("desktopfolder")) ============
[Test] AMW46_Registration.pdf
[Test] Cataract Simulations.sox
[Test] Chevy Chase Flag Crosswalk.napkin
[Test] Colorado Boulevard Flag Crosswalk.napkin
[Test] Golden Gate Bridge Photo.jpg
[Test] Mount Fuji in Winter.jpg
[Test] Personnel Roster.pandb
[Test] Real Estate Listings.pandb
[Test] US Airports.pandb
[Test] === END OF listfiles(info("desktopfolder")) ============
Displaying Info Functions in the Log
The results of the info( function can be displayed using the labelizeformula( function, but this is so common that Panorama has a special function to make this easier, labelizeinfo(. For example, to display the name of the current database, use this code:
zlog labelizeinfo("databasename")
The result will look something like this:
[Test] info("databasename") --> US Airports
If the function result contains more than one line, a different default pattern is used. For example, the code:
zlog labelizeinfo("files")
will put something like this into the log:
[Test] === info("files") ============
[Test] Contacts
[Test] Orders
[Test] Products
[Test] === END OF info("files") ============
Displaying a Dictionary in the Log
If you need to display a dictionary (see Data Dictionaries), use the zlogdictionary statement. For example, the code:
zlogdictionary windowinfo("","ALL")
will put something like this into the log:
[Test] == DICTIONARY windowinfo("","ALL") ============
[Test] DATABASE="Formula Workshop"
[Test] HORIZONTALSCROLLBAR=0
[Test] VARIABLES="
[Test] theWizardFormula
[Test] resultFormat
[Test] theWizardFormulaResult
[Test] theWizardFormulaError
[Test] theFormulaDatabase"
[Test] OPTIONS="NoToolBar NoHorzScroll NoVertScroll"
[Test] VERTICALSCROLLBAR=0
[Test] TOOLBAR=0
[Test] TYPE="Form"
[Test] LASTTIMEINFRONT=3673970363
[Test] NAME="Formula Workshop"
[Test] PROCEDURE=""
[Test] FORM="Formula"
[Test] === END OF DICTIONARY windowinfo("","ALL") ============
The parameter must be just a dictionary, you cannot mix in anything else.
Extra Logging Code
It’s rarely necessary, but if you need to run additional code only when logging is enabled, you can use the zlogging( function to check whether logging is currently enabled. For example if for some reason you wanted to display a message only when logging is enabled, you could do that.
if zlogging()
    message "Logging is enabled"
endif
Remember, you don’t need to use zlogging( when you are using the zlog and zlogdictionary statements, these statements already check whether logging is enabled.
See Also
- cgitest -- tests a CGI procedure.
- Client/Server Debug Instrumentation -- using instrumentation with Panorama X server and clients.
- Coding with Debug Instrumentation -- modifying your code to generate debug instrumentation output.
- Crash Proof Debug Instrumentation Monitoring -- real time crash-proof instrumentation monitoring
- Customizing Debug Instrumentation Coverage -- specifying what code is being debugged at the moment.
- Debug Instrumentation -- conditional logging of the internal state of Panorama program code.
- Debug Instrumentation Log Window -- dynamically monitor debug instrumentation output as your program runs.
- Debug Instrumentation Monitoring using an External Program -- monitoring debug instrumentation with an external program (Terminal.app, BBEdit.app).
- Debug Instrumentation Text File -- configuring and accessing the debug instrumentation log (text) file.
- getcookie( -- returns the value of a cookie submitted to the server.
- getcookielist( -- returns a list of cookies submitted to the server.
- info("httprequestinprogress") -- returns true if this code is running on Panorama X Server, and the server is responding to a web client request.
- info("runningunderterminal") -- returns the name of the terminal program if Panorama was launched under one, otherwise it returns empty text.
- info("webclientsessioninprogress") -- returns true if this code is running on Panorama X Server, and the server is responding to a web client request.
- labelize( -- returns the value of a field or variable along with a label. This saves typing when you need to display fields or variables when logging and debugging.
- labelizeformula( -- returns the value of a formula along with the formula itself as a label.
- labelizeinfo( -- returns the value of an info( function, along with the function itself as a label.
- labelizepattern( -- formats a text value using a label and a pattern.
- Recording Code Triggers in Debug Instrumentation -- the code triggers option automatically tracks whenever any code is triggered, whether from a menu, a button, or implicitly (for example when data is entered).
- Recording Control Flow in Debug Instrumentation -- configure debug instrumentation to automatically log when control flow is non-linear, for example a call, return, goto, etc.
- serverrunning( -- returns true if this code is running on a Panorama server, or false if it is running in single user mode or on a client.
- serverstatus( -- returns a dictionary describing the current status of Panorama X Server.
- setzlog -- turns instrumentation coverage on or off for a specific procedure (or all procedures within a database).
- urlfilename( -- extracts the filename from a complete url.
- urlpath( -- extracts the path from a URL.
- Web Error Pages -- customizing the server response when an error occurs.
- webhomesubfolder( -- returns the folder ID of a subfolder of the web server's home folder.
- webserverinfo( -- retrieves additional information about the web server and the current browser request.
- webtagortext( -- prepares text for display in a web page.
- webtext( -- converts a number or regular text into text encoded for display in a web browser.
- zlog -- outputs a message to the instrumentation log (if instrumentation is enabled).
- zlogalways -- unconditionally outputs a message to the instrumentation log.
- zlogcoverage -- allows instrumentation coverage to be turned on or off within a procedure.
- zlogdictionary -- outputs a data dictionary to the instrumentation log (if instrumentation is enabled).
- zlogging( -- returns true if zlogging is enabled for the current database and procedure, otherwise false.
History
| Version | Status | Notes |
| 10.2 | New | New in this version. |