A major obstacle to debugging code problems is that you cannot actually see what’s happening as the code runs. All of the variables, formulas and control flow are invisible inside the computer. Panorama’s Debug Instrumentation system is designed to reveal this hidden information. Once you can actually see what’s going on in your code, it becomes much easier to track down most problems.
Before instrumentation was available, a common debugging technique was to add message statements to the code to display variables and formulas. When the code was run, Panorama would stop at each message statement and display the value in an alert. This technique can be helpful, but it comes with some significant drawbacks.
- Stopping at every message statement is very disruptive and slows everything down, especially if the code has loops that run dozens or hundreds of times.
- Only one value can be displayed at a time, making it hard to see patterns or compare values at different points in the program’s execution.
- The displayed values are ephemeral, so you can’t save them for later analysis or share them with others.
- The act of displaying the value in an alert can change how the program works, especially if you are using secret windows, or for code that is implicitly triggered.
- Once you’ve finished debugging, you have to manually remove all of the message statements. If you later need to do more debugging, you’ll have to manually put them all back again.
For example, consider the blizzard of alerts that will appear if the message statement is used to debug this procedure with a loop:
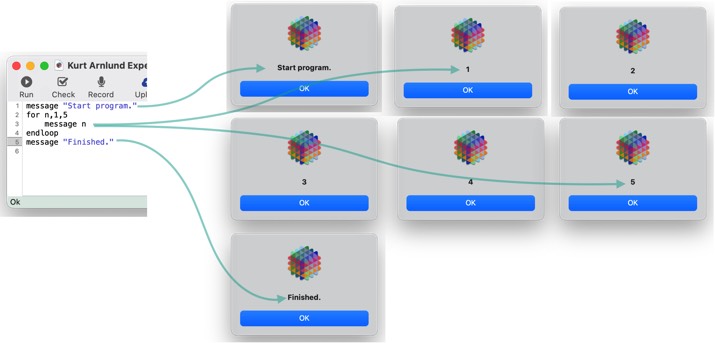
Panorama’s Debug Instrumentation is designed to give you the advantages of making the operation of your code visible, but without the disadvantages listed above. It’s just as easy to use as message statements, but without the drawbacks.
The Zlog statement
The heart of the instrumentation system is the zlog statement. You use this statement just as you would use the message statement, and the structure of the zlog statement is identical to the message statement- it takes a single parameter, a formula. But there are two key differences between the zlog and message statements:
- Instead of stopping to display the parameter value in an alert, the value is appended to the instrumentation Log. This log can be displayed dynamically as the program runs, or reviewed later (or both). Either way, the code doesn’t stop, it continues normally.
- When you’re not debugging, the zlog statement is skipped – Panorama just ignores it. When you’re finished debugging, you don’t have to remove the zlog statements - you can leave them in in case you need them later. (Of course you can remove them if you wish, it’s entirely your option.)
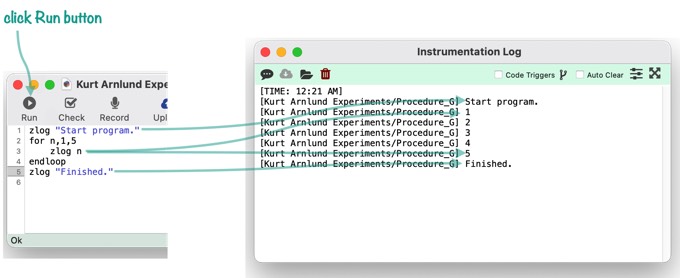
Here is a procedure similar to the procedure shown in the previous section, but using the zlog statement instead of message. This version of the code runs without stopping to show alerts, and generates the easily understandable log shown on the right.
Earlier I told you that the zlog statement is ignored if you’re not debugging. How does Panorama know you’re not debugging? All you have to do is close the procedure editor window. If you run this code with the editor window closed (for example, from the Action menu or triggered by a button), nothing will appear in the log. Only instrumentation information from procedures that are currently open for editing will appear in the log, so you’re not distracted by extraneous information from other procedures that you aren’t interested in at the moment. (I’m over simplifying a bit – it IS possible to see instrumentation information from specified procedures that aren’t currently open if you want. To learn how this is done, see Customizing Debug Instrumentation Coverage.)
The zlog statement is all you need, but Panorama does provide some additional statements and functions that can make it more convenient to output information to the log. For example, there is a special function for displaying variables with their names, and a special statement for displaying dictionaries. You don’t have to use these statements and functions, but they can make your instrumentation code easier to write. To learn more, see Coding with Debug Instrumentation.
Enabling Instrumentation
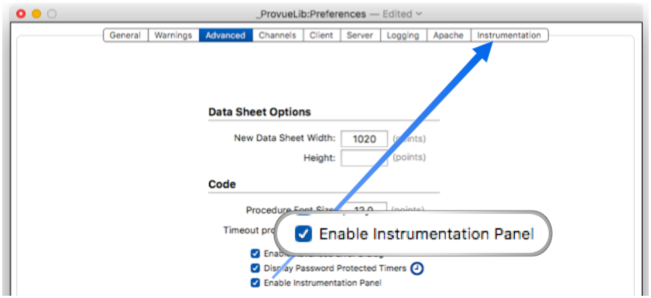
Out of the box, the Debug Instrumentation feature is turned off. To turn it on, start by opening the Preferences window (from the Panorama menu), then clicking on the Advanced tab, then clicking the Enable Instrumentation Panel checkbox. You’ll immediately see an additional panel option, Instrumentation.
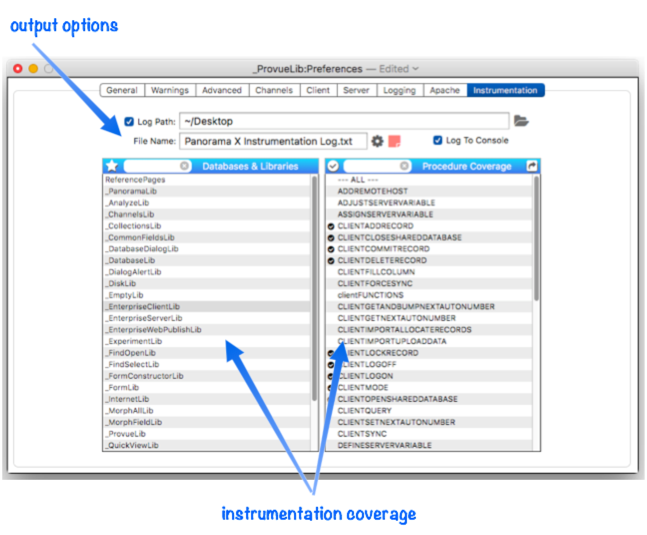
Here’s what this panel typically looks like. The top portion of the panel controls where the instrumentation output is sent, either a file or the console, or both (see Debug Instrumentation Text File). The bottom portion of the panel controls which databases and procedures currently have enabled instrumentation coverage (see Customizing Debug Instrumentation Coverage).
When the Instrumentation panel is enabled, you’ll also see a new Instrumentation menu at the end of the menu bar. This menu is displayed with a microscope icon.
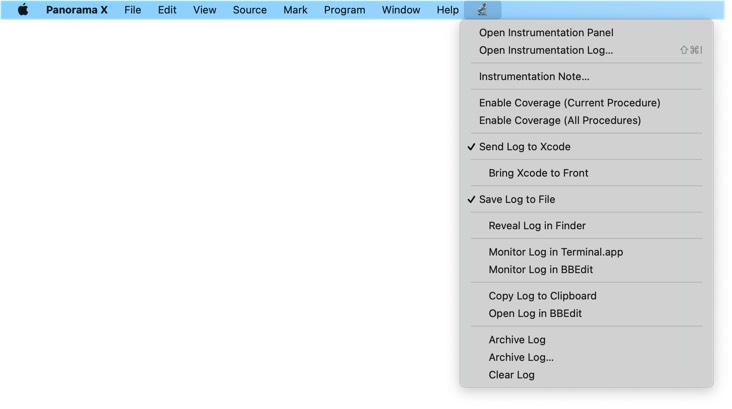
The top item in this menu provides quick access to the Instrumentation panel. The second item opens the dynamic log viewer. The other items provide quick, universal access to features in the Instrumentation panel without having to actually open that panel.
Viewing the Instrumentation Log
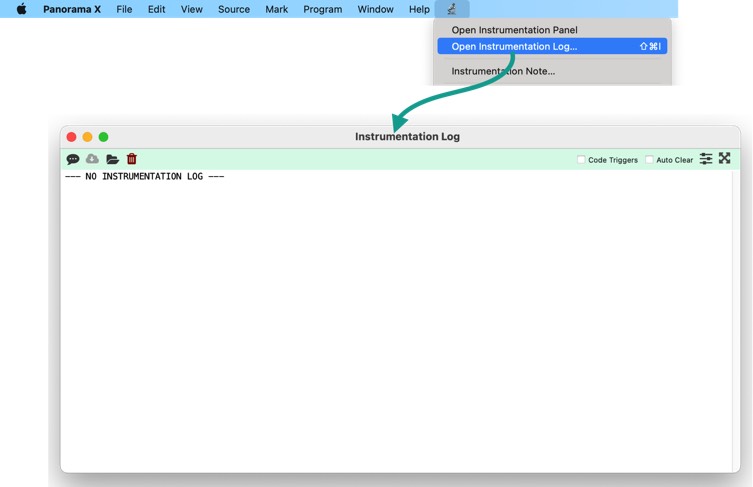
The easiest way to view the instrumentation output is to use the built in Instrumentation Log window. Simply choose Open Instrumentation Log from the Instrumentation menu whenever you want to see the instrumentation output. The new window will show recent Panorama instrumentation activity, and will automatically update as new activity occurs.
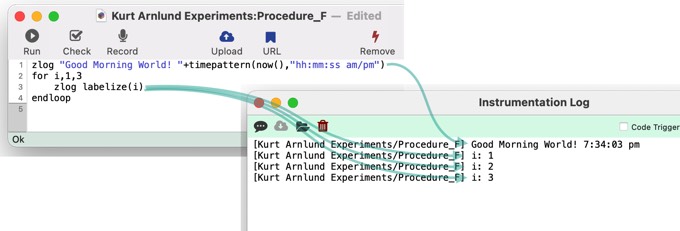
For example, this procedure contains two zlog statements that will output information to the log (the zlog statement is discussed in detail later on this page). If you run this procedure with the Instrumentation Log window open, the information will automatically appear in the log:
The top of the Instrumentation Log window contains a toolbar with common actions:
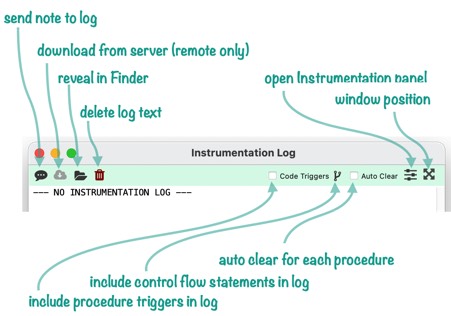
See Debug Instrumentation Log Window to learn the specifics of each of these tools.
Additional Debug Instrumentation Topics
As described above, it’s really simple to get started using Panorama’s Debug Instrumentation feature. Simply add one or more zlog statements to your code, open the Debug Instrumentation Log Window, then run your code and see what you get. When you’re done, simply close the Instrumentation Log window and your procedure window and use your code normally.
Beyond the basics described above, see these additional help pages to learn about additional Debug Instrumentation features.
- Debug Instrumentation Log Window – Learn how to use the Instrumentation Log window, and all of the tools on this window.
- Coding with Debug Instrumentation – Learn coding techniques for adding instrumentation to your procedures.
- Recording Code Triggers in Debug Instrumentation – Learn about “no code” techniques for tracking how and why your code is triggered, whether from a menu, a button, or implicitly (for example when data is entered).
- Recording Control Flow in Debug Instrumentation – Learn “no code” techniques for tracking the flow of control thru your code, including subroutines, goto, etc.
- Customizing Debug Instrumentation Coverage – Learn how to specify what code you are currently debugging (beyond only procedures that are currently being edited).
- Debug Instrumentation Text File – Learn how to configure and access the text file that is generated by the debug instrumentation system.
- Debug Instrumentation Monitoring using an External Program – Instead of the built in log window, you can use either Terminal.app or BBEdit to view the instrumentation logs.
- Crash Proof Debug Instrumentation Monitoring – Learn how to use the instrumentation system in situations where Panorama may crash.
See Also
- Client/Server Debug Instrumentation -- using instrumentation with Panorama X server and clients.
- Coding with Debug Instrumentation -- modifying your code to generate debug instrumentation output.
- Crash Proof Debug Instrumentation Monitoring -- real time crash-proof instrumentation monitoring
- Customizing Debug Instrumentation Coverage -- specifying what code is being debugged at the moment.
- Debug Instrumentation Log Window -- dynamically monitor debug instrumentation output as your program runs.
- Debug Instrumentation Monitoring using an External Program -- monitoring debug instrumentation with an external program (Terminal.app, BBEdit.app).
- Debug Instrumentation Text File -- configuring and accessing the debug instrumentation log (text) file.
- info("runningunderterminal") -- returns the name of the terminal program if Panorama was launched under one, otherwise it returns empty text.
- labelize( -- returns the value of a field or variable along with a label. This saves typing when you need to display fields or variables when logging and debugging.
- labelizeformula( -- returns the value of a formula along with the formula itself as a label.
- labelizeinfo( -- returns the value of an info( function, along with the function itself as a label.
- labelizepattern( -- formats a text value using a label and a pattern.
- Recording Code Triggers in Debug Instrumentation -- the code triggers option automatically tracks whenever any code is triggered, whether from a menu, a button, or implicitly (for example when data is entered).
- Recording Control Flow in Debug Instrumentation -- configure debug instrumentation to automatically log when control flow is non-linear, for example a call, return, goto, etc.
- setzlog -- turns instrumentation coverage on or off for a specific procedure (or all procedures within a database).
- zlog -- outputs a message to the instrumentation log (if instrumentation is enabled).
- zlogalways -- unconditionally outputs a message to the instrumentation log.
- zlogcoverage -- allows instrumentation coverage to be turned on or off within a procedure.
- zlogdictionary -- outputs a data dictionary to the instrumentation log (if instrumentation is enabled).
- zlogging( -- returns true if zlogging is enabled for the current database and procedure, otherwise false.
History
| Version | Status | Notes |
| 10.2 | New | New in this version. |