One of the best feature’s of Panorama’s debug instrumentation is that it only works when you need it to. When you’re not debugging, it stays silent and tucked away. Even when you are debugging, it only shows you instrumentation results from the code you are actually working on, so that the results aren’t clogged up by code that you aren’t interested in at the moment. For the most part, Panorama does this automatically for you, but you can override the automatic behavior to tell Panorama exactly what code you are interested in at the moment. Most of this page is spent describing these override techniques.
Automatic Instrumentation Coverage for Open Procedure Windows
By default, instrumentation coverage is turned off except for procedures that are currently open for editing – instrumentation is automatically enabled for those open windows. In most cases this means you don’t have to worry about enabling coverage at all – just open the procedure window and the instrumentation coverage for that procedure will automatically be enabled. This means you don’t have to worry about the methods described below for enabling and disabling instrumentation coverage. When you’re finished with your debugging session, just close the procedure window and instrumentation coverage for that procedure will automatically be disabled (you don’t have to remove any zlog statements that you have used in your code).
Note: If you only want to use instrumentation for open procedures, you can skip the rest of this page!
Disabling Automatic Coverage for Open Procedure Windows
If for some reason you don’t want opening a procedure window to automatically enable instrumentation coverage, click on the star icon in the Instrumentation panel and un-check the Enable Coverage for All Open Procedures option.
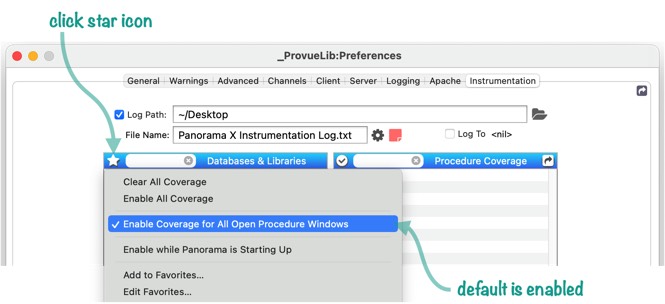
For the most part, however, you’ll want to leave this option enabled. It makes working with instrumentation much simpler.
Note that whether or not this option is enabled, you can always explictly enable coverage for specific procedures using the techniques described below. This allows instrumentation to continue working even if the procedure window is closed. Of course it also means that you’ll have to remember to explictly disable the coverage later when you’re finished with your debugging sessions.
Customizing Instrumentation Coverage
If needed, you can customize instrumentation coverage at the level of individual procedures. Typically you set up the coverage you want, run the code you want to test, then turn the coverage back off again. (Usually you don’t want to leave coverage on all the time for two reasons. First, it can create large log files that are unwieldy to work with. Secondly, enabled instrumentation can impact the performance of the code – in other words, the code runs somewhat slower when coverage is enabled. So you usually want to turn coverage off when you’re not using it.)
The bulk of the Instrumentation panel is devoted to specifying what procedures will produce instrumentation output. By default, instrumentation coverage is turned off except for procedures that are currently open (as described above). To see instrumentation output for procedures that aren’t currently open, you must enable coverage for those procedures. This can be done with the Instrumentation Menu, with the list of procedures in the Instrumentation Panel or by setting up and using Instrumentation Favorites.
Customizing Coverage from the Instrumentation Menu
If a procedure window is open, you can quickly enable or disable coverage for that procedure by choosing Enable Coverage (This Procedure) from the Instruments menu. You don’t even have to open the Instrumentation panel to do this. (You do, however, have to add one or more zlog statements to the procedure.)
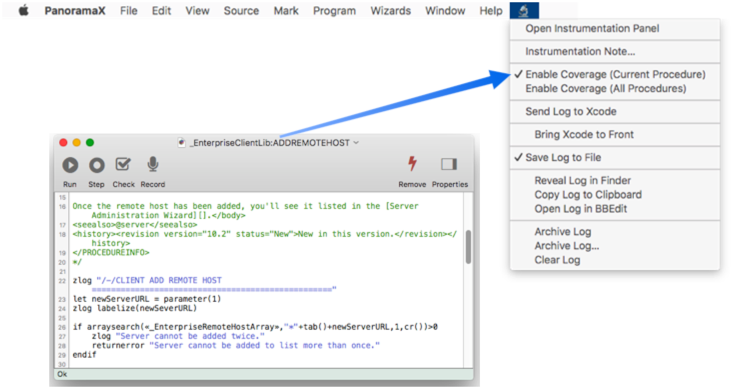
Once this option is checked, instrumentation for this procedure will be enabled whether it is open or not. Even if you close the procedure window, the instrumentation in that procedure will still generate output when you run the procedure. When you don’t want to use instrumentation with this procedure any more, you’ll need to explicitly disabled the coverage, either by re-opening the procedure and un-checking the option, or using the Instrumentation Panel to disable the coverage as described below.
If you want to enable coverage for all procedures in this database, choose the Enable Coverage (All Procedures) command from the menu. Once checked, instrumentation will be enabled for every procedure in this database, whether the editor window is open or not.
Customizing Coverage from the Instrumentation Window
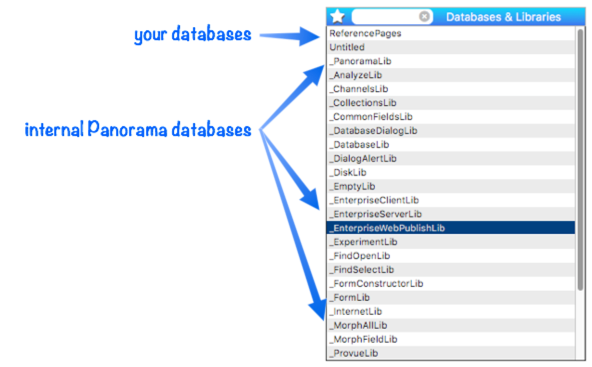
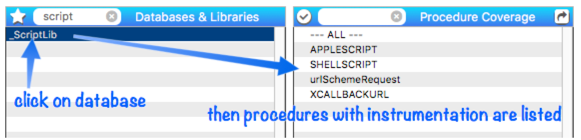
The Instrumentation Window (part of the Preferences window) is a good way to enable or disable coverage of multiple procedures quickly. The left side of the panel lists all of the currently open databases. Your databases are listed at the top, followed by Panorama’s internal databases (yes, you can enable coverage for Panorama’s internal code).
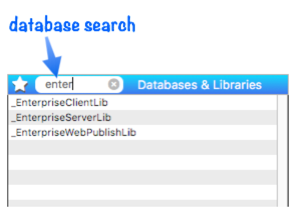
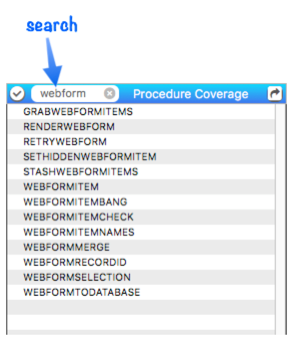
Since the list can be rather long, you have the option of searching to quickly find the database you want.
Clicking on a database allows you to change the coverage of the procedures in that database. All of the procedures that are enabled for instrumentation are listed (procedures that do not contain zlog statements are not listed, so for some databases, the list may be empty).
Click anywhere on a procedure to toggle whether or not instrumentation is enabled for that procedure.
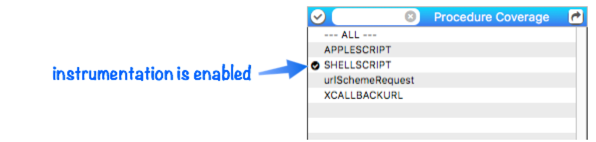
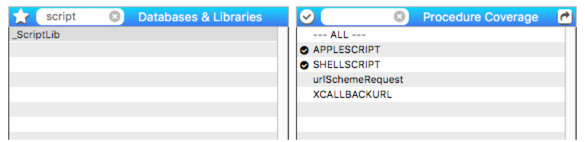
Instrumentation for the ShellScript statement is now enabled. If you run a procedure that contains this statement, you’ll see information about the internal operation of this statement in the log.
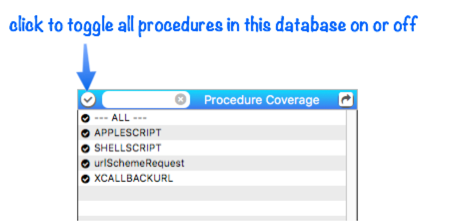
In addition to toggling procedures individually, there are shortcuts to toggle multiple procedures. Hold down the Shift key to toggle a range of procedures, from the previous click to this one. To toggle all procedures in this database, click on the larger checkbox at the top of the list.
If you want to enable coverage for all procedures in a database, another method is to click on the --- ALL --- item at the top of the list. If this item is checked, coverage is enabled for every procedure, no matter what other items are checked.
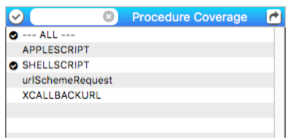
In the example above, coverage for all of these procedures is enabled, even though only one is checked. This is a nice way to temporarily enable all procedures, allowing you to easily go back to the more custom coverage when you’re finished.
If a database has a long list of procedures, you can search to winnow the list and quickly find the procedures you are interested in.
Using Instrumentation Favorites
Panorama includes several favorite configurations for instrumentation coverage, and you can also set up your own favorites. If you are working with Panorama technical staff, they may ask you to use one or more favorites to set up coverage. Instrumentation favorites are accessed by clicking on the star icon.
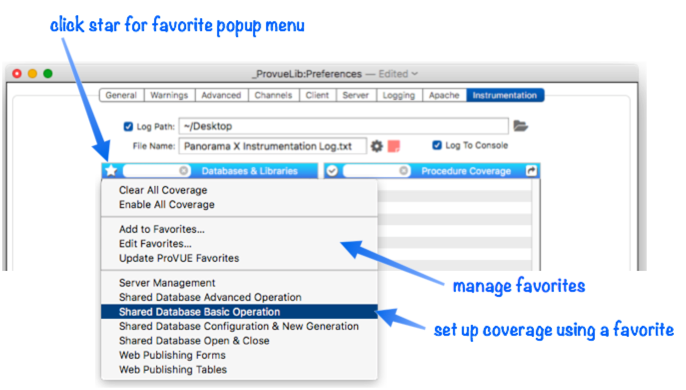
Choosing one of the favorite options will automatically set up coverage for a collection of procedures, as set up by the person who created the favorite (usually either you or ProVUE Development). Panorama will automatically start sending instrumentation output to the log as the specified procedures are used.
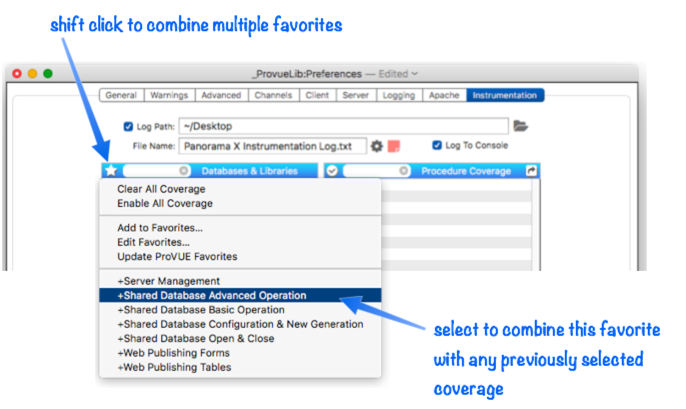
Combining Multiple Favorites Normally choosing a favorite turns off all other coverage, but in some situations you may want to combine the coverage of two or more favorites. To do this, first select one of the favorites as described above. Then hold down the Shift key and click on the star again. The names of the favorites are prefixed with a + symbol to show that the coverage will be added to the previously selected coverage, rather than replacing the existing coverage.
The end result in this example is that coverage is now set up for both basic and advanced shared database operation.
When you want to switch to different coverage, simply choose another favorite, or choose the Clear All Coverage option.
Creating your own favorites will be covered later on this page.
Working with Favorites
Once you’ve set up the coverage you want, you can save it as a favorite so that you can easily recall that same coverage later. For example, suppose you’ve set up coverage for scripting, like this:
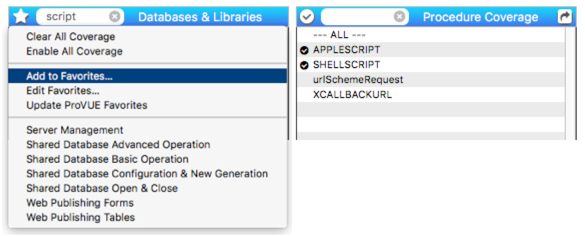
To save this, click on the star and choose Add to Favorites… from the pop-up menu.
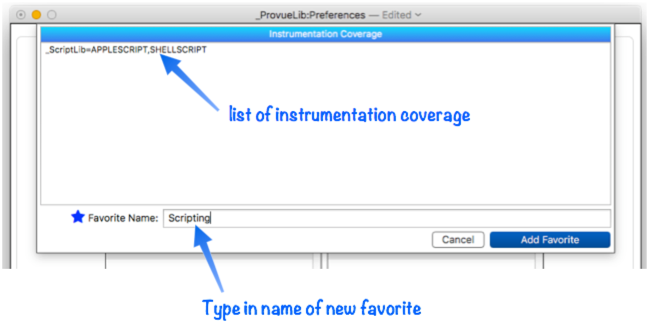
The top part of this dialog lists your current instrumentation coverage. You’ll see each database and each procedure that is covered. This is handy as a reminder of what coverage you have set up. Type in the name of the new favorite at the bottom and press the Add Favorite button. (Note: You should avoid names that end with (Client) or (Server), these names have special meaning.
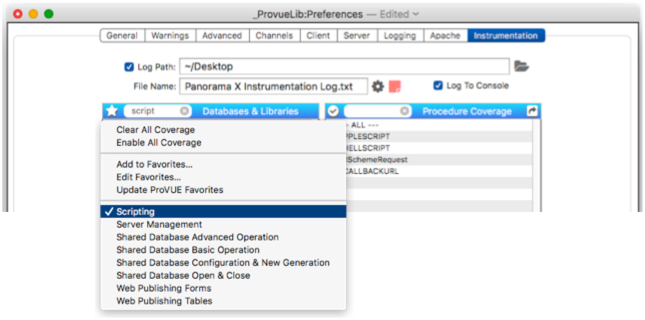
Your new favorite now appears in the pop-up menu when you click on the star. The favorites are listed in the menu in alphabetical order.
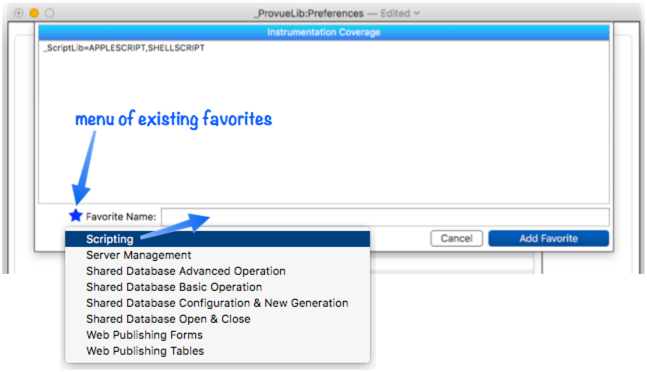
Updating a Favorite There’s a bit of a trick you can use to modify an existing favorite. Start by modifying the coverage the way you want, then click on the star and choose Add to Favorites…. Now type in the name of the favorite you want to modify. When you press the Add Favorite button, the existing favorite will be updated. To save you the trouble of typing in the name of the favorite again, you can click on the star to choose from the list of existing favorites.
Renaming and Deleting Favorites To rename and/or delete a favorite, click on the star and choose Edit Favorites…. This displays a dialog that lists each favorite, one per line.
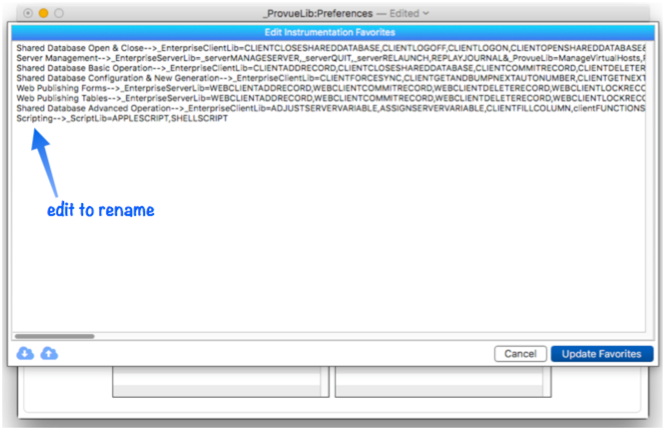
To rename a favorite, simply edit the name. To delete a favorite, select and delete the entire line. If you are careful, you could also manually edit the coverage of a favorite, but we don’t recommend this. When your changes are complete, press the Update Favorites button.
Updating Factory Default Favorites
Panorama X comes pre-loaded with intrumentation favorites set up by ProVUE Development. These favorites aren’t actually part of Panorama itself, they are downloaded from the provue.com server, so they can be updated as needed. Panorama automatically checks for updates every time you open the Preferences window, but you can also force an immediate update by clicking on the star and choosing Update ProVUE Favorites.
Note: Since these favorites will get automatically updated, you probably don’t want to edit or remove them – they will just revert to their factory configuration the next time the Preference window is opened. If you want to modify one of these favorites, first select it, then modify the coverage, then add it as a new favorite.
Enabling Coverage During Panorama Startup
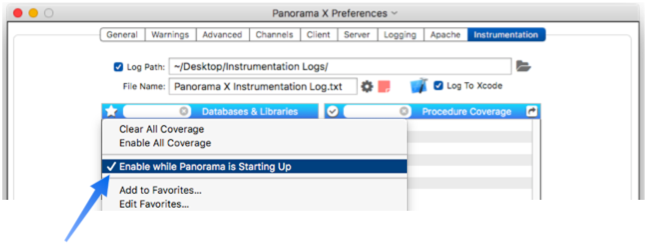
Panorama runs a lot of code when it first launches. Usually you are not interested in this code, so Panorama automatically disables log output during the startup process. If you do want to see logs of startup activity, click on the white star and check the Enable while Panorama is Starting Up option.
Keep in mind that depending on what coverage you have enabled, this can produce pages and pages of output before you even get your database open.
Coverage Links
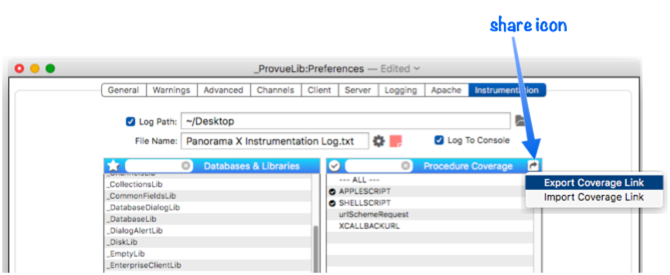
Panorama allows you to export the current instrumentation coverage as a link. You can save the link for later, or send it to another computer, for example via email, etc. First set up the coverage you want, then click on the Share icon and choose Export Coverage Link from the pop-up menu.
The link will look something like this (it may be much longer if you have a lot of databases and procedures included in the coverage.
panoramax://zlog?_ScriptLib=APPLESCRIPT,SHELLSCRIPT
There are two ways you can use this link. First, you can copy it into the clipboard, then click on the star icon and choose Import Coverage Link.
Secondly, you can simply click on the link in any application that works with links – web browsers, email clients, Messages.app, Slack, etc. The link will automatically bring Panorama to the front (even launching Panorama if it is not already open) and set up the coverage according to the contents of the link. You don’t even need to open the Preferences window, Panorama simply activates the specified coverage automatically.
See Also
- Client/Server Debug Instrumentation -- using instrumentation with Panorama X server and clients.
- Coding with Debug Instrumentation -- modifying your code to generate debug instrumentation output.
- Crash Proof Debug Instrumentation Monitoring -- real time crash-proof instrumentation monitoring
- Debug Instrumentation -- conditional logging of the internal state of Panorama program code.
- Debug Instrumentation Log Window -- dynamically monitor debug instrumentation output as your program runs.
- Debug Instrumentation Monitoring using an External Program -- monitoring debug instrumentation with an external program (Terminal.app, BBEdit.app).
- Debug Instrumentation Text File -- configuring and accessing the debug instrumentation log (text) file.
- info("runningunderterminal") -- returns the name of the terminal program if Panorama was launched under one, otherwise it returns empty text.
- labelize( -- returns the value of a field or variable along with a label. This saves typing when you need to display fields or variables when logging and debugging.
- labelizeformula( -- returns the value of a formula along with the formula itself as a label.
- labelizeinfo( -- returns the value of an info( function, along with the function itself as a label.
- labelizepattern( -- formats a text value using a label and a pattern.
- Recording Code Triggers in Debug Instrumentation -- the code triggers option automatically tracks whenever any code is triggered, whether from a menu, a button, or implicitly (for example when data is entered).
- Recording Control Flow in Debug Instrumentation -- configure debug instrumentation to automatically log when control flow is non-linear, for example a call, return, goto, etc.
- setzlog -- turns instrumentation coverage on or off for a specific procedure (or all procedures within a database).
- zlog -- outputs a message to the instrumentation log (if instrumentation is enabled).
- zlogalways -- unconditionally outputs a message to the instrumentation log.
- zlogcoverage -- allows instrumentation coverage to be turned on or off within a procedure.
- zlogdictionary -- outputs a data dictionary to the instrumentation log (if instrumentation is enabled).
- zlogging( -- returns true if zlogging is enabled for the current database and procedure, otherwise false.
History
| Version | Status | Notes |
| 10.2 | New | New in this version. |