When the Code Triggers option is enabled, Panorama will automatically add a log entry every time code is triggered. Sometimes you’ll be trying to track down an error and you’re not even sure what procedure is being triggered – the Code Triggers feature will quickly show you.
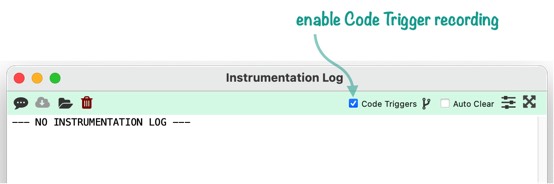
If you are using the Instrumentation Log window, enabling this feature is as simple as clicking on the Code Triggers checkbox in the upper right corner.
Whenever the Code Triggers option is turned on, Panorama will automatically add an entry to the Instrumentation Log every time a procedure is triggered, whether explicitly or implicitly. Whenever a menu is chosen, a button is pressed, or implicit code is triggered, the exact trigger will be noted for later examination. This is especially useful for implicit code since you may not be aware that the code is even being triggered (see Implicitly Triggered Procedures).
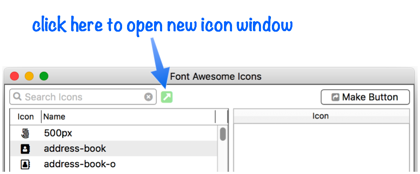
To illustrate how this works, I’ll use the Help>Font Awesome Icons window that is built into Panorama. This window uses Panorama code, and we can use the Code Triggers feature to see what code is triggered as we perform operations with this window. For example, suppose you click on the button that opens a new window:
If the Code Triggers option is enabled, clicking this button will cause two new lines will appear in the instrumentation log:
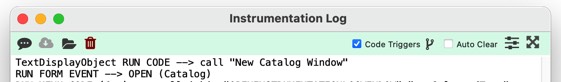
The first line records that you clicked on a Text Display Object, and that this object had code associated with it which was run. The log even includes the code itself (if the database is locked down then the code will be redacted). This is an explicit trigger.
The button code opens a new cloned Catalog form. The Catalog form has been set up to implicitly trigger code when it opens. This implicit code trigger has been recorded on the second line of the log (RUN FORM EVENT). If there was a problem in opening the window, the log shows that Panorama got as far as the OPEN FORM EVENT code, so that might be a good place to start looking for the problem.
As this example shows, since the instrumentation log not only shows code in your own databases that are triggered, but code that is built in to Panorama itself (code supplied by ProVUE), it can be educational to enable the CodeTriggers option and then start clicking on things in Panorama to see what is being triggered. (Note: Some code built into Panorama is protected and will not be recorded.) Of course it will be even more common to trigger actions in your own databases to assist with your debugging.
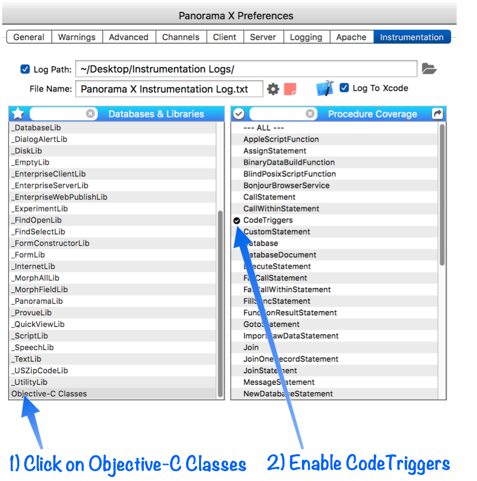
Enabling Code Trigger Recording with the Instrumentation Panel
If you are not using the Instrumentation Log window (see [Debug Instrumentation Monitoring using an External Program]), you can still enable the Code Triggers feature using the Instrumentation panel of the Preferences window. First click on Objective-C Classes at the bottom of the list on the left, then click on CodeTriggers on the right.
To turn the feature off again, click on CodeTriggers again.
See Also
- Client/Server Debug Instrumentation -- using instrumentation with Panorama X server and clients.
- Coding with Debug Instrumentation -- modifying your code to generate debug instrumentation output.
- Crash Proof Debug Instrumentation Monitoring -- real time crash-proof instrumentation monitoring
- Customizing Debug Instrumentation Coverage -- specifying what code is being debugged at the moment.
- Debug Instrumentation -- conditional logging of the internal state of Panorama program code.
- Debug Instrumentation Log Window -- dynamically monitor debug instrumentation output as your program runs.
- Debug Instrumentation Monitoring using an External Program -- monitoring debug instrumentation with an external program (Terminal.app, BBEdit.app).
- Debug Instrumentation Text File -- configuring and accessing the debug instrumentation log (text) file.
- info("runningunderterminal") -- returns the name of the terminal program if Panorama was launched under one, otherwise it returns empty text.
- labelize( -- returns the value of a field or variable along with a label. This saves typing when you need to display fields or variables when logging and debugging.
- labelizeformula( -- returns the value of a formula along with the formula itself as a label.
- labelizeinfo( -- returns the value of an info( function, along with the function itself as a label.
- labelizepattern( -- formats a text value using a label and a pattern.
- Recording Control Flow in Debug Instrumentation -- configure debug instrumentation to automatically log when control flow is non-linear, for example a call, return, goto, etc.
- setzlog -- turns instrumentation coverage on or off for a specific procedure (or all procedures within a database).
- zlog -- outputs a message to the instrumentation log (if instrumentation is enabled).
- zlogalways -- unconditionally outputs a message to the instrumentation log.
- zlogcoverage -- allows instrumentation coverage to be turned on or off within a procedure.
- zlogdictionary -- outputs a data dictionary to the instrumentation log (if instrumentation is enabled).
- zlogging( -- returns true if zlogging is enabled for the current database and procedure, otherwise false.
History
| Version | Status | Notes |
| 10.2 | New | New in this version. |