The Summary Workshop wizard is a tool for quickly summarizing, analyzing and charting large amounts of data. The workshop can rapidly categorize the information in a database and calculate totals, averages, counts, minimum/maximums and standard deviation.
Opening the Summary Workshop
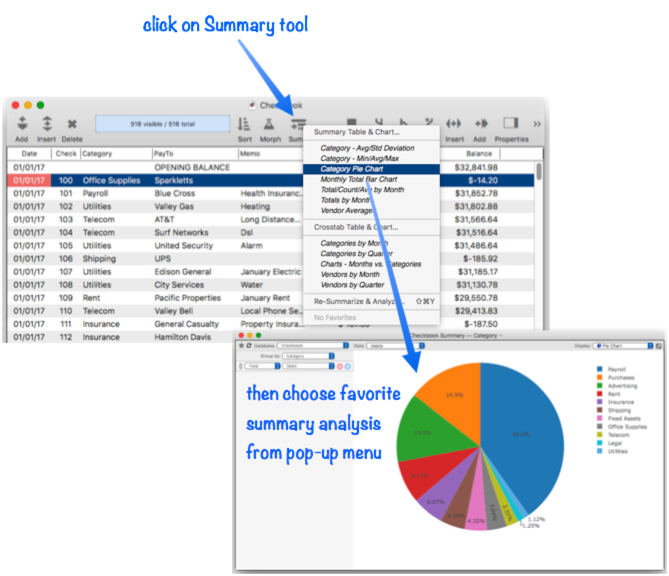
To open the Summary Workshop, click on the Summary tool and choose Summary Table & Chart from the pop-up menu.
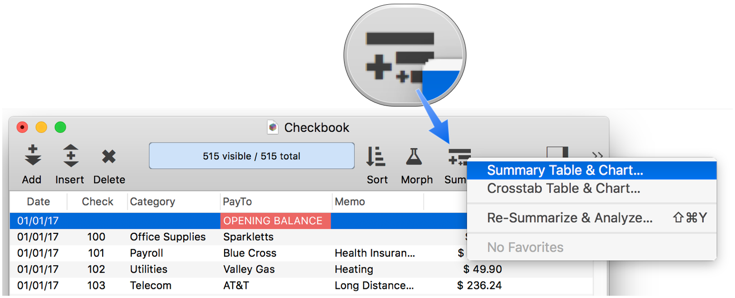
You can also open the Summary Workshop from the menu bar by choosing Field>Analyze>Summary Table & Chart.
Note: You can open more than one Summary Workshop window at the same time. Each Summary Workshop window can display a separate summary, making it easy to put different summaries side-by-side for comparisons. To open another Summary Workshop window, either click on the Summary tool again, or choose New Summary Window from the Window menu.
Summary Groups
Use the Group by pop-up menu to specify how the database should be divided into groups. This menu lists all the non-numeric fields in the database. If a field contains dates, you are given the option to group by different calendar periods (month, quarter, year, etc.)
Note: If you do want to group by a numeric field, open the Preferences window and enable the Allow grouping on numeric fields option.
Summary Computations
To specify what computations should be performed, use the popup menus in the computation settings panel. Specify an operation and numeric field for each column in the summary workshop.
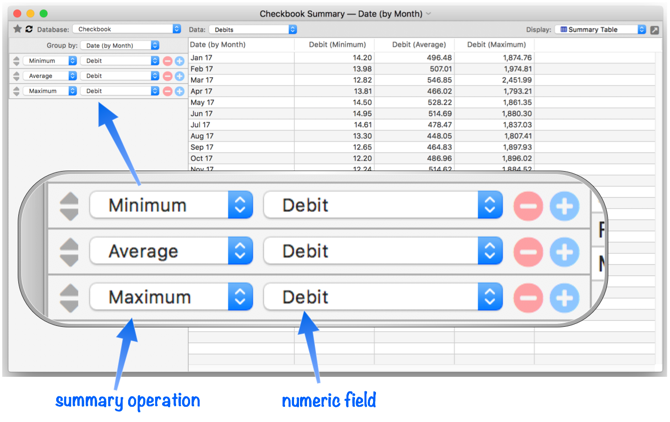
Summary Operations
There are 8 summary operations available:
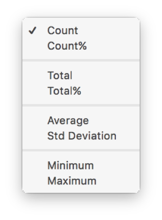
Count
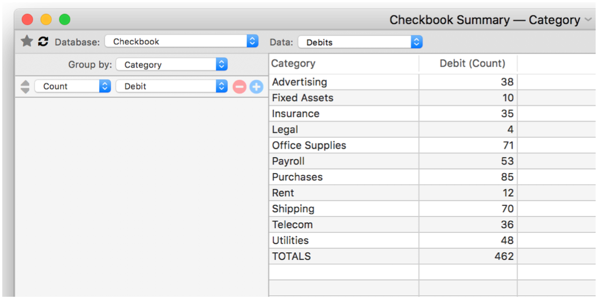
The Count option displays raw record counts. (When this option is used, it doesn’t matter what field is selected – the field value is ignored.)
Count%
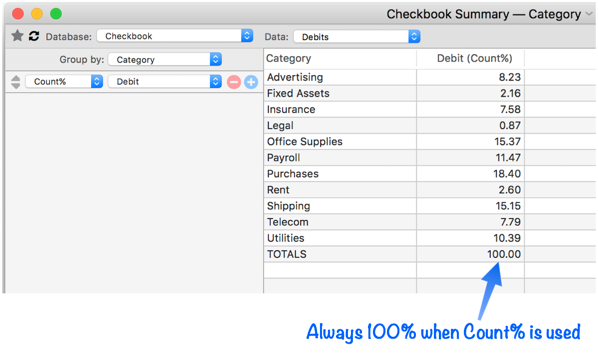
The Count% option display record counts as a percentage of the count of analyzed records. When this option is used, the TOTAL line is always 100%.
Total
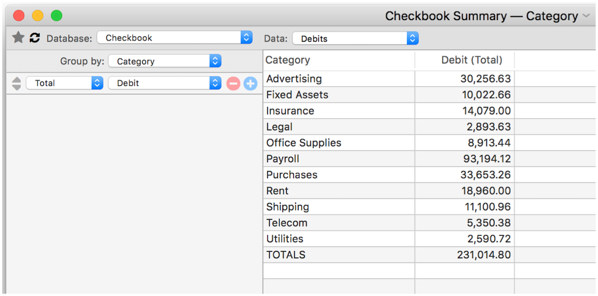
This option computes the total of the specified field.
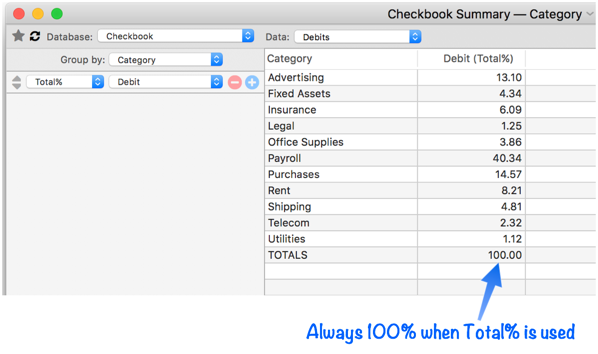
Total%
This option computes the total of the specified field, then displays the totals as a percentage of the grand total. When this option is used, the TOTAL line is always 100%.
Average
This option computes the average of the specified field.
Standard Deviation
This option computes the standard deviation from the average for the specified field. (In statistics, the standard deviation is a measure that is used to quantify the amount of variation or dispersion, of a set of data values. A low standard deviation indicates that the data points tend to be close to the average of the set, while a high standard deviation indicates that the data points are spread out over a wider range of values. See Standard Deviation to learn more.
Minimum and Maximum
These options compute the minimum and maximum values for the specified field.
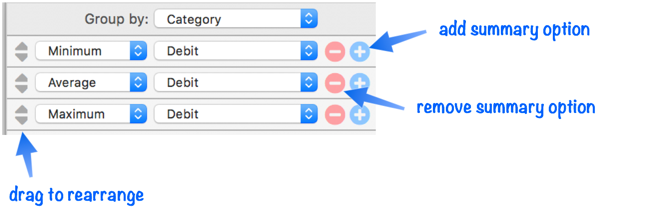
Adding and Rearranging Summary Operations
When the Summary Workshop is first opened there is only one summary operation. To add another, press the + icon. To remove a summary operation, press the - icon. To rearrange summary operations, drag on the up/down icon.
Revealing the Underlying Data
To reveal the underlying raw data behind any summary row, simply right click on the row and choose Select Original Data.
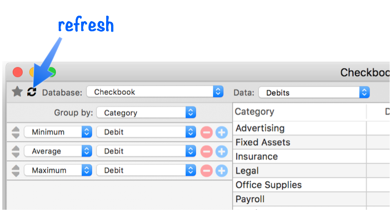
Refreshing Summaries when Data Changes
To refresh the summaries with the latest changes to the database, click on the refresh tool.
Analyzing a Data Subset
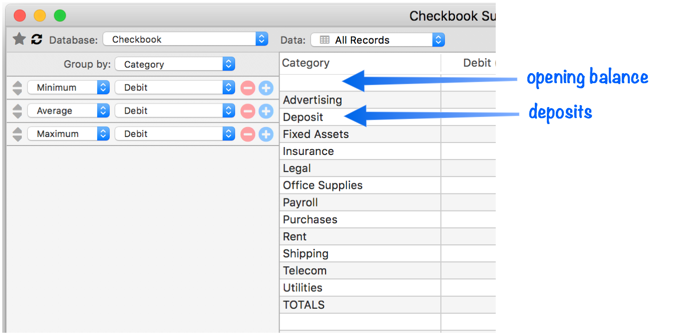
The Summaries Workshop normally analyzes all the records in the entire database, whether they are visible or not. Sometimes, however, that’s not what you want. This sample checkbook database, for example, contains items other than checks, which you probably don’t want to include in the analysis.
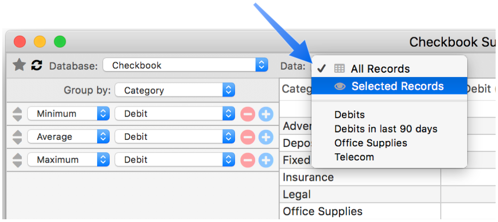
One solution is to use the Find/Select Dialog to select only the checks, and then to choose Selected Records from the Data pop-up menu.
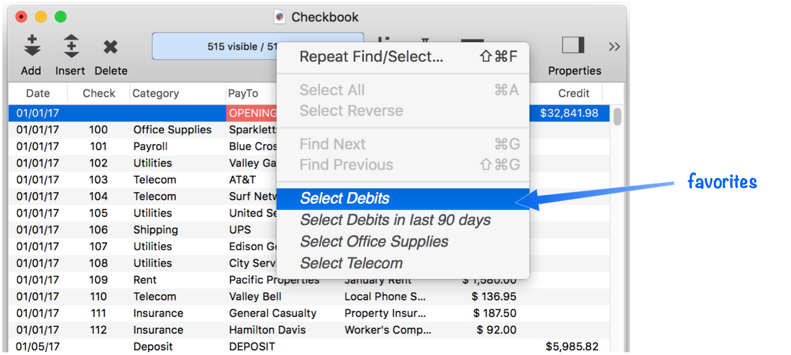
A more permanent solution is to use the Find/Select Dialog to set up a favorite search. See Favorite Searches to learn how to set these up. I’ve set up several favorite searches in this checkbook database, including Debit, which selects all records with a debit greater than zero (in other words, all checks, but no deposits).
To use any of these favorite searches in the Summary Workshop, simply select it from the Data popup menu.
From now on, the Summary Workshop will always analyze based on the data in this favorite search, no matter what data is currently selected in the database itself. The workshop will also take this search into account when revealing underlying data. Only records that match the favorite will be revealed.
Saving a Favorite Summary
Once you’ve set up a summary just the way you want it, you can save it for re-use later. To save a favorite, click on the star and choose Add to Favorites. Give the summary configuration a name and press RETURN or ENTER to have that name replace the default name NEW_FAVORITE in the listing, then press Done. (Note: To permanently save this favorite, you must save the underlying database.)

To instantly pull up a previously saved favorite, just click on the star and select it from the pop-up menu.
You can also quickly pull up a favorite summary by clicking on the Summary tool in the toolbar of a data sheet or form. The pop-up menu will list all of the favorite summaries you have saved. Selecting a favorite will open a new Summary Workshop window that immediately displays that favorite.
To delete a favorite summary, click on the star and choose Edit Favorites. Click on the minus button to delete any favorite.
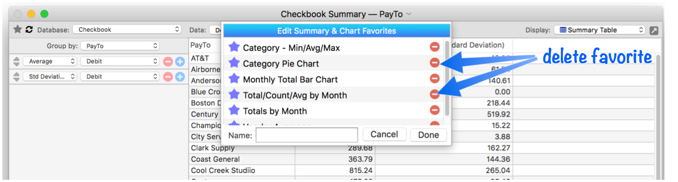
To rename a favorite summary, click on the star and choose Edit Favorites. Click on the favorite you want to change, then type in the new name, then press the Return key.
You can’t change the summary criteria used by a favorite summary. If you need to make a change, simply delete the favorite and then set it up again.
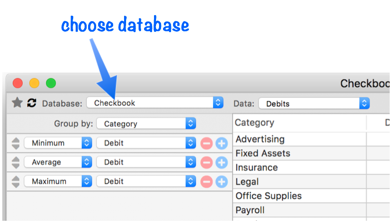
Alternate Database
When the Summary Workshop is opened, it is connected with the database that was open. You can use the pop-up menu to switch to any open database (you can also choose from the Database menu).
Remember, you can open multiple Summary Workshop windows, and each one can be a different database if you wish.
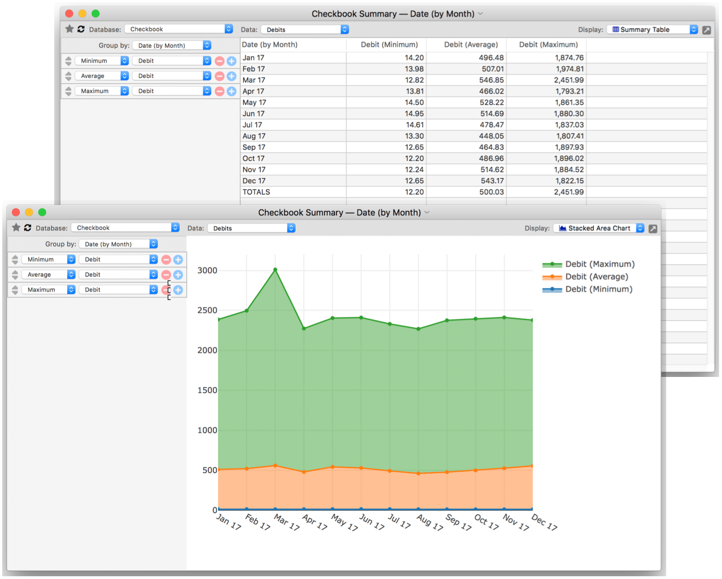
Chart Display
In addition to tabular display, the Summary Workshop can also display various kinds of charts. Simply choose the type of chart you want to see from the Display popup menu.
The charts are interactive – when you hover over them a label appears showing the data value.

You can turn on spike lines to make it easier to see where each value falls on the axes.
You can zoom in and out, pan, and reset the zoom.

The other tools in the chart toolbar are not operational.
Multiple Column Charts
Many chart styles can also work with multiple summary columns.
When the chart displays mutiple summary columns, you can choose whether hovering shows just one data value or all data values at that point.
The Summary Menu
The Summary menu performs various utility functions, including refreshing the summary values and exporting the summary.
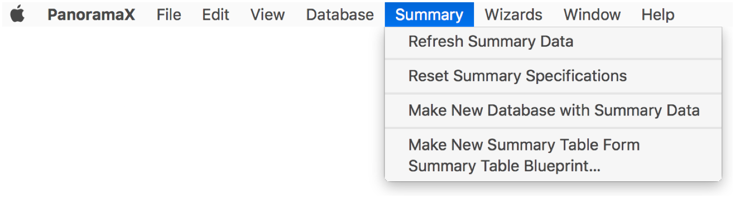
Refresh Summary Data
To refresh the summaries with the latest changes to the database, choose this menu option or click on the refresh tool.
Reset Summary Specifications
This command resets all summary options to their defaults, making it easy to start over with a new summary analysis.
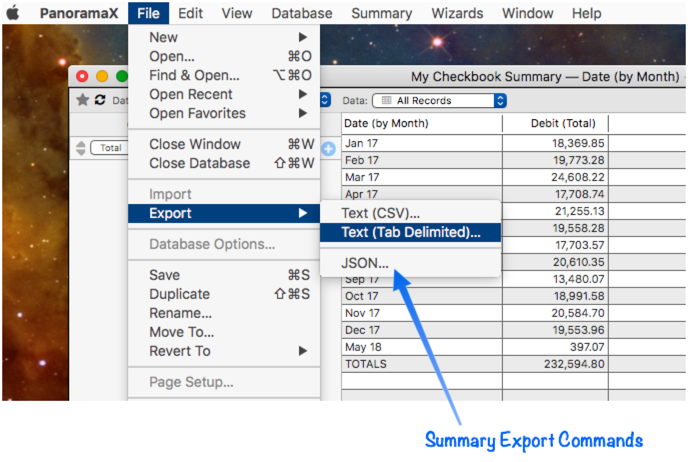
Export Summary Results to a Text File
Use the File>Export menu to export the summary results to a text file in TSV (tab separated, CSV (comma separated), or JSON format (used with JavaScript and web coding. When you choose these operations you’ll be asked for the location of the new exported file, then it will be exported:
Make New Database with Summary Data
This command exports the summary analysis into a new, untitled database. You can then save this analysis data separately, export it to a text file, or do whatever you want with it.
Although the exported database is separate from the original database, the Summary Workshop creates two procedures in a special Summary menu that maintain a link to the original database. Using these items you can go back to view the original data that went into a summary, and you can also refresh this analysis database with any changes to the data in the original database.
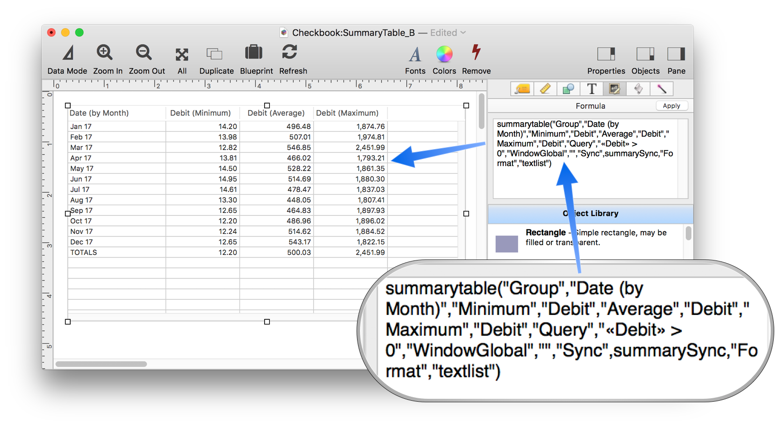
Make New Summary Table Form
This command creates a new form in the original database, and creates a Text List Object in that form that displays the current summary analysis. In other words, it makes this analysis a permanent part of the database. From that point forward, you can view this analysis simply by opening that form, you don’t have to re-open the Summary Workshop. You can manipulate this form like any other form – change the object properties, add other objects, etc.
The summarytable( function is used to actually generate the summarized data. You can customize the formula Panorama generates to your specific needs.
To learn more about the options available, see the summarytable( function.
Linking Back to the Original Data
When creating the Text List Object, Panorama adds code to link the object back to the original data.
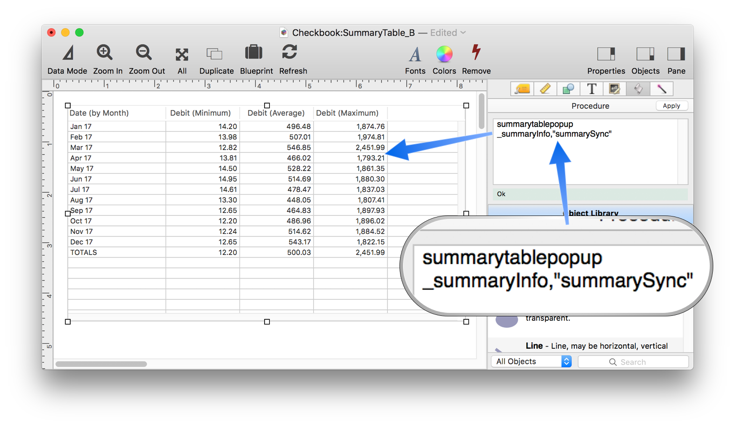
With this code in place, right clicking on a row (in Data Mode) will trigger a pop-up menu that allows you to select the original data, or to refresh the summary display.
To learn more about linking back to the original data, see Linking a Text List Summary Table With Original Data in the summarytable( function.
Make New Summary Chart Form
If the Summary Workshop is currently displaying a chart, the Make New Summary Table Form command changes into the Make New Summary Chart Form command. This command creates a new form in the original database, and creates a Web Browser Object in that form with a chart( function, making this chart a permanent part of the database. From that point forward, you can view this chart simply by opening that form, you don’t have to re-open the Summary Workshop. You can manipulate this form like any other form – change the object properties, add other objects, etc.
The chart( and summarytable( functions are used to actually generate the summarized data. You can customize the formula Panorama generates to your specific needs.
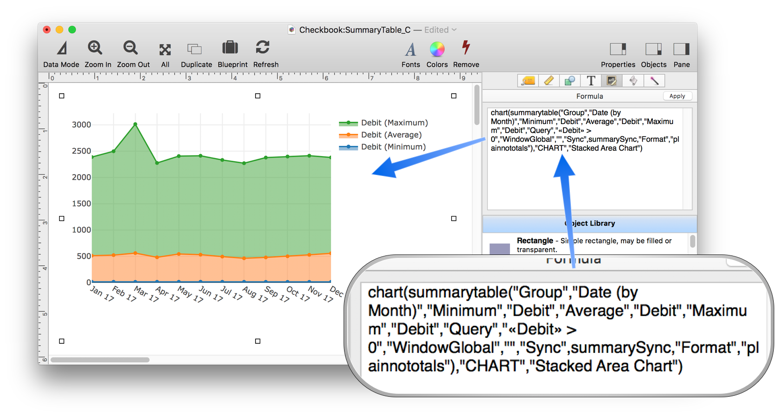
You can change the the formula to modify the chart.
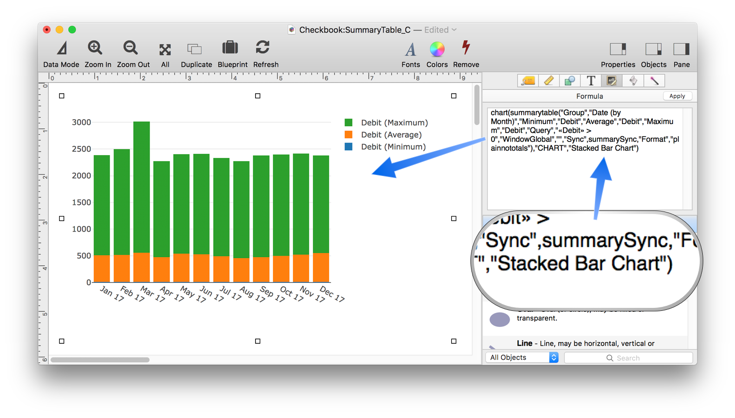
To learn more about the options available, see the chart( and summarytable( functions.
Embellishing the Summary Table/Chart Form
For simplicity, the Summary Workshop creates a new form with a single summary table or chart. But you should consider that just a starting point. You can modify the created object, add other objects, even copy the created object to another form. Here is an example with both a summary table and a chart combined onto a single form.
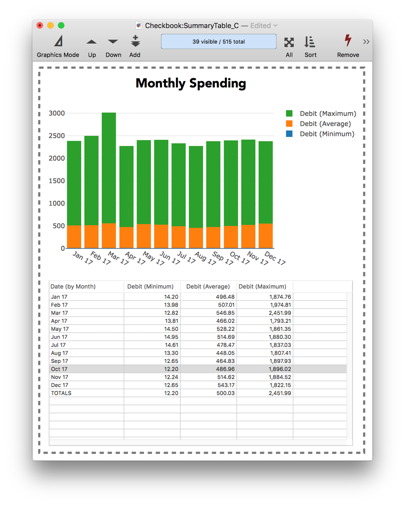
You can also put multiple tables on a single form, multiple charts, any combinations you want.
Summary Table Blueprint
This command displays a blueprint of the form object used to display the current summary table or chart. See Form Object Blueprint to learn more about these blueprints.
See Also
- aggregate( -- calculates an aggregate (sum (total), count, minimum, maximum or average) by scanning specified records in a database.
- chart( -- converts a table of data into an HTML page with a chart (bar, line, pie, etc.).
- Crosstab Workshop -- tool for two dimensional summarizing, analyzing and charting large amounts of data.
- crosstab( -- converts information in a database into a crosstab table (tab delimited text).
- formulasum -- calculates a total by scanning a database, returning the accumulated sum of evaluating a formula over and over again for each scanned record.
- groupdatepattern( -- converts a number representing a date into text in a special format for use with the summarytable( and crosstab( functions. The function uses a pattern to control how the date is formatted (see Date Patterns).
- refreshsummarydatabase -- refreshes a summary database.
- summarydatabaseselectoriginal -- selects original data corresponding to a cell in an exported summary table database.
- summaryselectoriginalformula -- returns the formula that will select the original data associated with a summary table row.
- summarytable( -- scans a database to build a text array containing summary breakdown information: totals, averages, etc.
- summarytablepopup -- handles a click on a summary table text list.
History
| Version | Status | Notes |
| 10.2 | Updated | Can now export the summary body as a text file in .csv, .tsv (tab delimited) or .json format. |
| 10.1 | New | New in this version. |