The summarytable( function scans a database to build a text array containing summary breakdown information: totals, averages, etc.
Parameters
This function has two parameters:option – an option name. The summarytable( function must include one or more option/value pairs that customize the generated summaries, for example the type of summary operation (total, average, count, etc.), group field, summary format, etc. These option/value pairs are discussed in more detail below.
value – option value (must appear as a pair with an option name).
Description
This function scans a database to build a text array containing summary breakdown information: totals, averages, etc. The summary information can be displayed in rows and columns in a Text List object, used with the chart( function to display a chart, or exported to a file or variable.
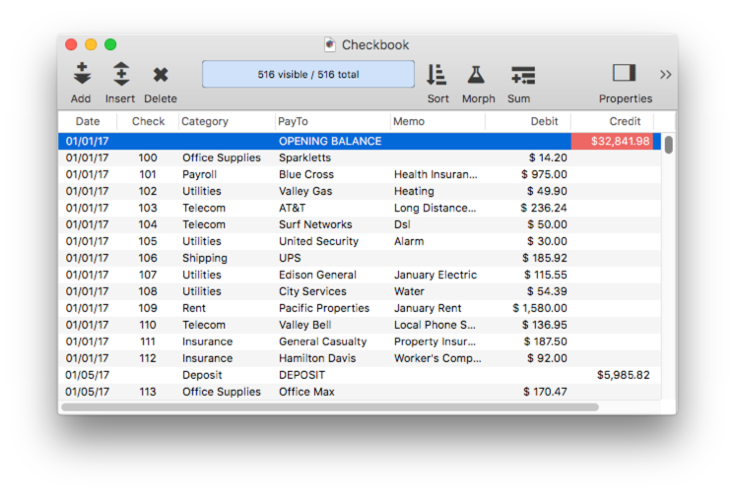
Most of the examples on this page will use a standard Checkbook database with a data sheet that looks like this:
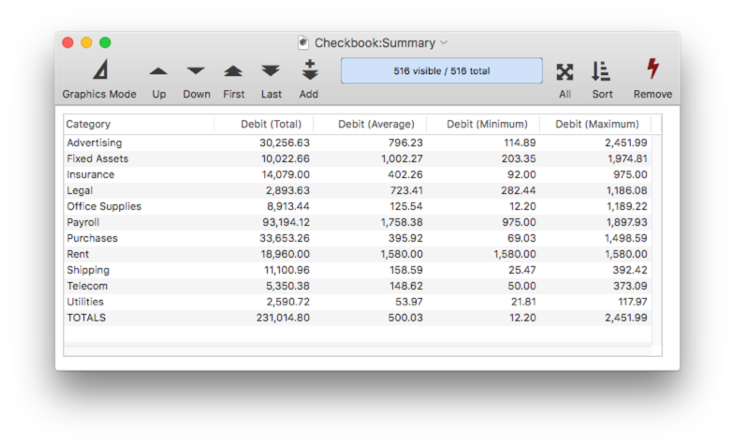
With the summarytable( function, you’ll be able to take this raw data and display a summarized analysis, as shown below. This example takes the raw checkbook data, divides it into categories, and summarizes it four ways – by total, average, minimum and maximum. All of this is completely customizable.
Summary Table Basics
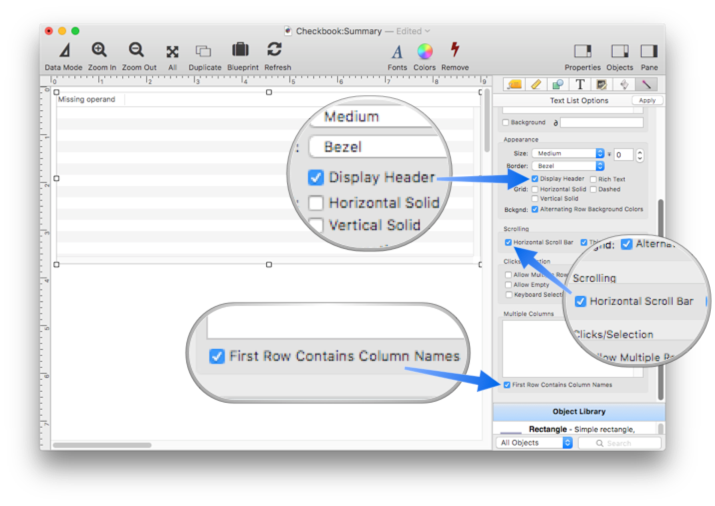
To display a summary table in a Panorama form, start by creating a Text List Object, and enable the Display Header and First Row Contains Column Names options. You may also probably want to enable the Horizontal Scroll Bar option. (Note: Instead of creating a summary table manually as shown in the steps below, you can ask Panorama’s Summary Workshop to create one for you automatically – it’s usually a lot easier and faster to do it this way. See Summary Workshop to learn how to do this. Still, learning how to create a summary table manually will help when creating more complex summaries.)
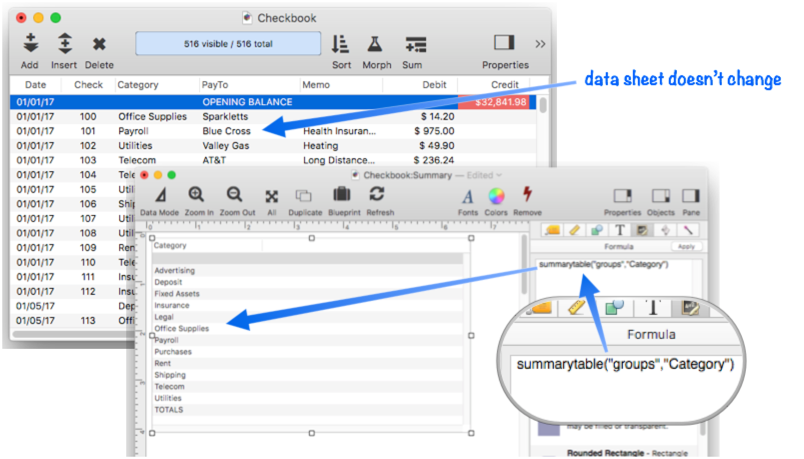
Now switch to the Formula panel and enter the formula summarytable("groups","Category") When you press the Apply button, a list of categories in the database will appear, as shown below. Notice that the data sheet window doesn’t change, the category list is built on-the-fly.
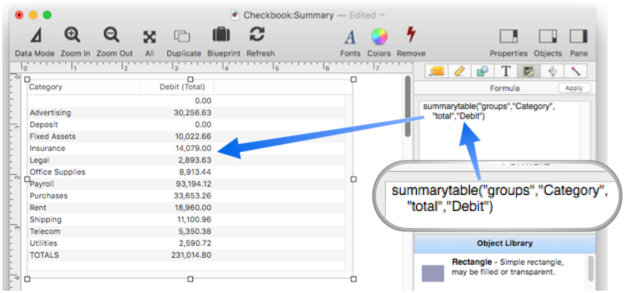
Next I’ll change the formula to calculate the Debit totals for each category. The new formula is:
summarytable("groups","Category","total","Debit")
The summary table now shows the categories with subtotals, and a grand total on the bottom.
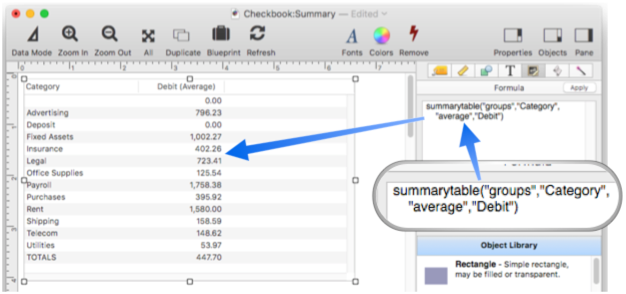
The formula can be changed to calculate the average instead of the total.
summarytable("groups","Category","average","Debit")
Here’s the result when you press the Apply button.
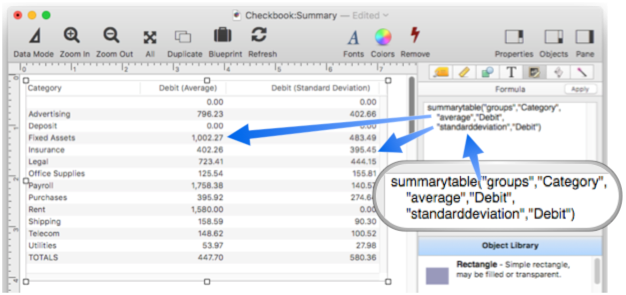
The function can perform multiple calculations at once, producing two or more columns of numbers.
summarytable("groups","Category","average","Debit","standarddeviation","Debit")
Now there are columns for both the average and the standard deviation from the average:
Now that you’ve learned the basics of creating a summary table, let’s dive into the details.
Summary Groups
The summarytable( function can divide the raw data into groups based on a formula you supply. Most commonly the group formula will simply the name of a field in the database, in this case the Category field.
summarytable("groups","Category","total","Debit")
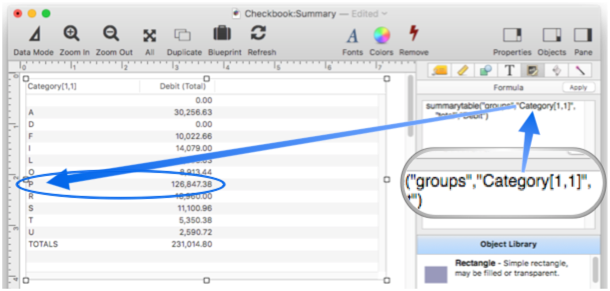
The group formula isn’t restricted to a single field, it can be a more complex formula. This formula, for example, groups by the first letter of the category field.
summarytable("groups","Category[1,1]","total","Debit")
As you can see, Payroll and Purchases both begin with P, so in this example they are combined into a single summary row.
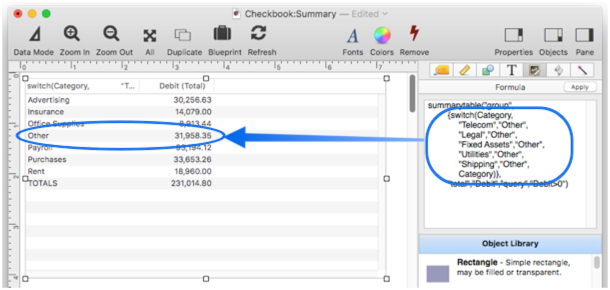
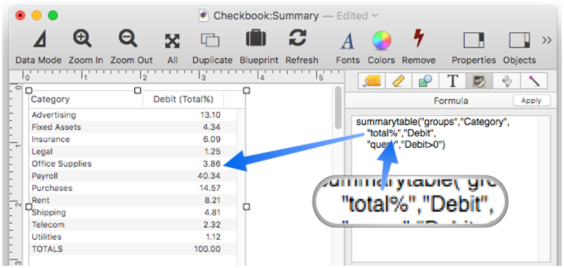
Here is a more complicated formula that combines five categories into a single “Other” category.
summarytable("group",
    {switch(Category,
        "Telecom","Other",
        "Legal","Other",
        "Fixed Assets","Other",
        "Utilities","Other",
        "Shipping","Other",
    Category)},
    "total","Debit","query","Debit>0")
Again, note that this formula tranforms the data on-the-fly, the original database data is not affected.
Note: You may notice that the title for the summary category column shows the formula, which is probably not what you want. To learn how to fix this, see the Custom Column Titles section below.
Grouping by a Date Field
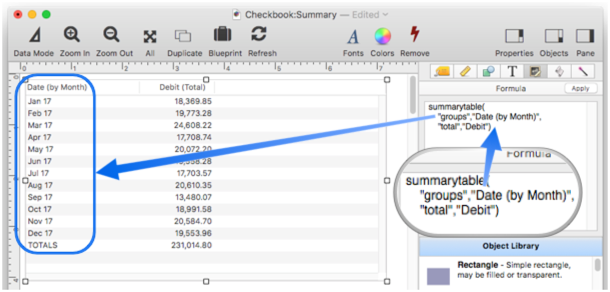
If the database being summarized contains a date field, you may want to group by day, month, quarter or year. The easiest way to do that is to add a suffix specifying the date period: (by Year), (by Quarter), (by Month) or (by Day). The checkbook example database has a field named Date, so a monthly summary can be produced like this:
summarytable("groups","Date (by Month)","total","Debit")
Here is the result displayed in a Text List object.
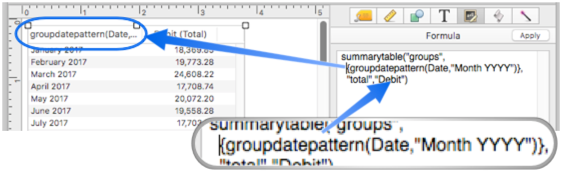
For more control over the format, use the groupdatepattern( function. This function is similar to the datepattern( function but formats the output in a special way so that it will work with the summarytable( and crosstab( functions (see below). This example is similar to the previous example, but will format the date with the month fully spelled out (instead of just the first three letters) and with four digits for the year.
summarytable("groups",{groupdatepattern(Date,"Month YYYY")},"total","Debit")
Here is the result displayed in a Text List object.
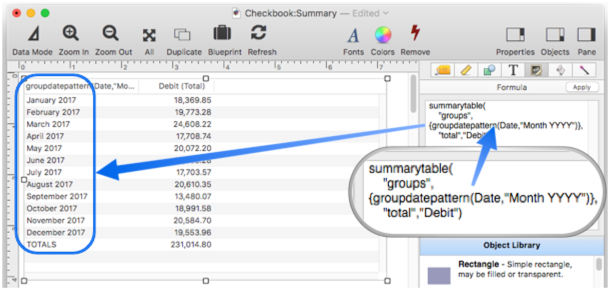
Be sure to use groupdatepattern( and not the datepattern( function. If you use the datepattern( function the summaries will appear out of order (in alphabetical order instead of chronological order).
Grouping in Non-Alphabetic Order
Groups are normally listed in alphabetic order. By adding a special prefix to the group formula, you can change the order in which groups are listed. The prefix, is used to determine the order of the groups, but is not displayed. The prefix is separated from the actual data with a tab character. For example, suppose you had a database that contained information about Gold, Silver and Bronze medals. Normally these groups would be listed alphabetically as Bronze, Gold and Silver. This code shows how the summarytable( function can be forced to display the items in the traditional order.
summarytable("groups",{replace(Medal,
    "Gold","1"+tab()+"Gold",
    "Silver","2"+tab()+"Silver",
    "Bronze","3"+tab()+"Bronze",
    ...
    )
For date values, the groupdatepattern( function automatically generates the correct prefix to make sure the date summaries are listed in the correct order (see above).
Specifying the Summary Operation and Data
There are six primary summary operations: total, count, average, standarddeviation, minimum and maximum. Whenever you specify a summary operation, it must be paired with a formula that specifies the data to be calculated. This formula is usually just a database field, but any formula can be used (it must be quoted however, see Quotes). This example calculates totals on the Debit field.
summarytable("groups","Date (by Month)","total","Debit")
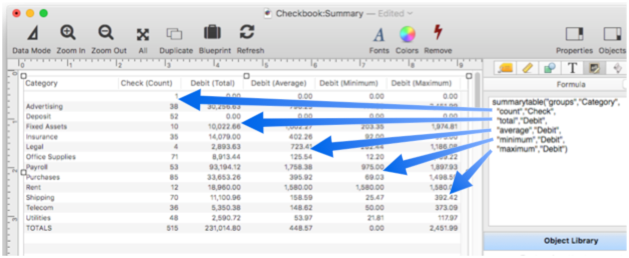
You can specify multiple pairs of summary operations with formulas. Each pair will be displayed in a separate column in the result.
summarytable("groups","Category",
    "count","Check",
    "total","Debit",
    "average","Debit",
    "minimum","Debit",
    "maximum","Debit")
This formula will result in six columns (the category column plus five summary columns)
The total and count operations can be modified by adding a % suffix. This causes the output to be calculated as a percentage instead of as an absolute value.
summarytable("groups","Category","total%","Debit")
The last line is always 100%.
To save typing, some operations can be abbreviated:
total ☞ sum
average ☞ avg
standarddeviation ☞ stddev
minimum ☞ min
maximum ☞ max
Summarizing a Data Subset
The summarytable( function normally scans and summarizes all of the records in the entire database. If you want to include only a subset of the data, use the query option. This option must be followed by a formula that specifies what records to include in the summary. The formula must be quoted, see Quotes.
For example, the checkbook example database we have been using contains both checks (debits) and deposits (credits). To include only debits in the summary, use the query formula Debit>0.
summarytable("groups","Category","total","Debit","query",{Debit>0})
The summarytable( function normally doesn’t care what records have been selected with the Find/Select command. If you want to summarize only visible records, use the info(“visible”) function in the query formula.
summarytable("groups","Category","total","Debit","query",{info("visible")})
Alternate Summary Database
The summarytable( function normally analyzes and summarizes the current database, but you can optionally specify any open database. This formula summarizes Inventory data by Vendor.
summarytable("database","Inventory","groups","Vendor","total","Price")
If the database option is omitted, the current database is assumed.
Custom Column Titles
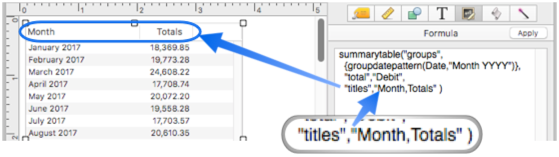
The summarytable( function normally generates column titles automatically, but you can use the titles option to customize the titles. For example, this formula probably doesn’t generate the titles you want.
summarytable("groups",{groupdatepattern(Date,"Month YYYY")},"total","Debit")
This revised formula displays better custom titles.
summarytable("groups",{groupdatepattern(Date,"Month YYYY")},
    "total","Debit",
    "titles","Month,Totals")
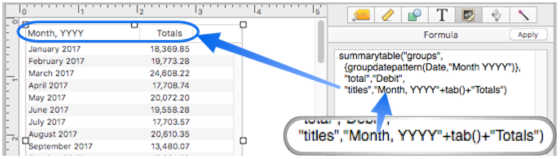
The titles option must define a title for every column being generated, with a tab or comma between each title name. If you want to include a comma in a title name itself, you must use tabs, like this.
summarytable("groups",
   {groupdatepattern(Date,"Month YYYY")},
   "total","Debit",
   "titles","Month, YYYY"+tab()+"Totals")
Summary Layout Format
By default, the summarytable( function normally generates output that is specifically formatted for display in a Text List object, with special tags to set up column widths and alignment (see Text List Multiple Columns to learn more about these tags). If you display the output in a Text Display Object, you can see the tags being output.
summarytable("groups","Category","total%","Debit")
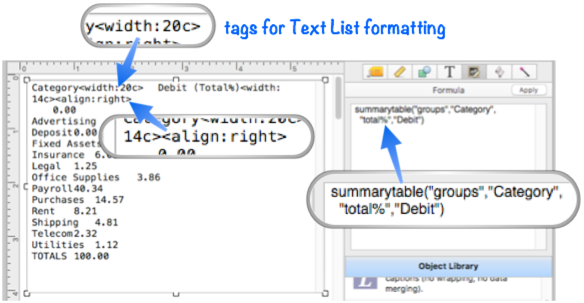
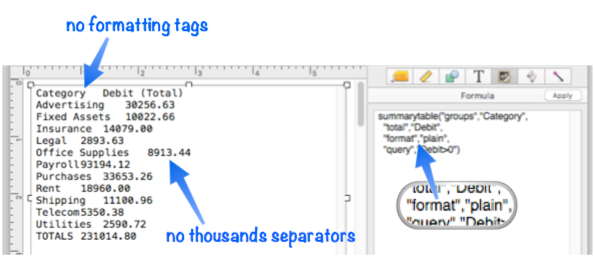
If you want plain output without the Text List tags, use the format option set to "plain", as shown below. The plain option is useful if you want to export the data for further processing, or to be used as chart( function data.
summarytable("groups","Category","total","Debit","format","plain")
In addition to eliminating the Text List tags, this option also cuts out the thousand separators in numbers (e.g. 1234 instead of 1,234).
If the format option is omitted, or set to "textlist", the tags and thousand separators will be included.
Excluding the Grand Total
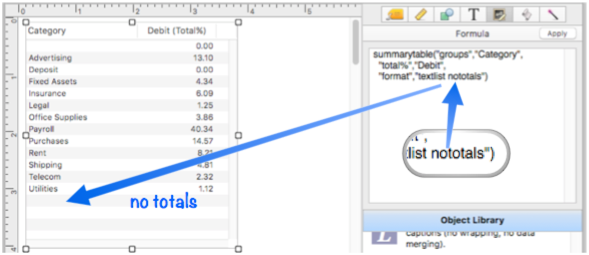
The format option can also be used to omit the grand total (the last line of the summary information). When this is done, only the groups are included, not the overall total/count/average for the entire data set. To omit the overall totals, add nototals to the format option. This can be combined with the textlist and plain options described above.
summarytable("groups","Category","total%","Debit","format","textlist nototals")
Numeric Formatting
The summarytable( function normally formats numbers for you automatically, but you can customize this.
Digits After the Decimal Point
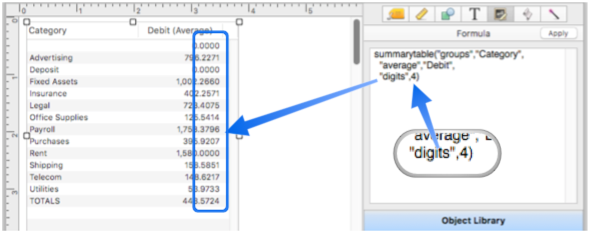
Counts are formatted with no decimal point, and all other summary operations (total, average, etc.) with two places after the decimal point. You can override this with the digits option, which can be set from 0 to 9 places after the decimal point.
summarytable("groups","Category","average","Debit","digits",4)
This example displays the averages with 4 digits after the decimal point.
Thousands Separator
Numbers with four or more digits to the left of the decimal point normally include thousand separators, for example 12,345.67, unless the plain format (see above) option is used. You can customize this behavior with the thousands option.
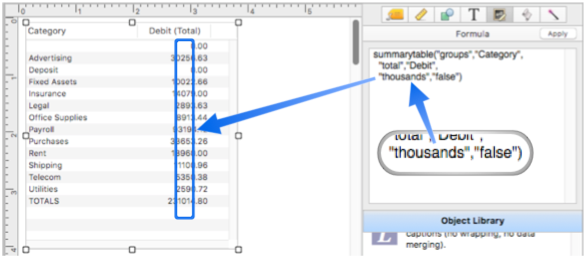
summarytable("groups","Category","total","Debit","thousands","false")
This example displays the totals without any thousand separators.
Custom Patterns
If you want full control over numeric format, use the patterns option instead of the digits and thousands options. The patterns option allows you to specify the exact numeric pattern (see Numeric Patterns) for each summary column. The patterns are separated by the tab character. This example displays the count as an integer, the total with 2 digits after the decimal point and a dollar sign prefix, the average with 4 digits after the decimal point, and the min and max with 2 digits.
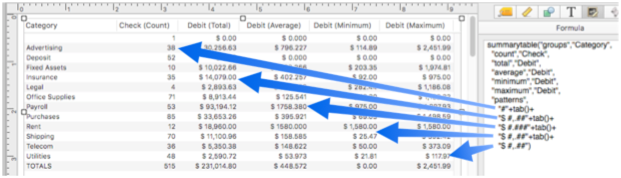
summarytable("groups","Category",
    "count","Check",
    "total","Debit",
    "average","Debit",
    "minimum","Debit",
    "maximum","Debit",
    "patterns","#"+tab()+"$ #,.##"+tab()+"$ #.###"+tab()+"$ #,.##"+tab()+"$ #,.##")
This formula will result in six columns (the category column plus five summary columns)
Alternately, you can customize the patterns used for each type of summary operator using the totalpattern, countpattern, averagepattern, minimumpattern, maximumpattern and standarddeviationpattern options. This example formula will produce the exact same results as the example formula above:
summarytable("groups","Category",
    "count","Check",
    "total","Debit",
    "average","Debit",
    "minimum","Debit",
    "maximum","Debit",
    "countpattern","#",
    "totalpattern","$ #,.##",
    "averagepattern","$ #.###",
    "minimumpattern","$ #,.##",
    "maximumpattern","$ #,.##")
An advantage of this approach is that you can override only the patterns you want to customize, leaving the others as default. (In the formula above, the countpattern option could have been omitted, since "#" is the default pattern for the count operator.)
Custom Summary Templates
The summarytable( function uses six templates to build the final summary table. These templates are normally set up for you automatically by using the format option (see above), but for ultimate control you can hand code these templates yourself. If you customize these templates yourself that should be done before using the format option, otherwise the format option will wipe out your custom templates (the parameter options are processed in reverse, from right to left). The six templates are: toptemplate, datacolumnheadertemplate, groupcolumnheadertemplate, titlenametemplate, rowtemplate and bottomtemplate.
toptemplate controls the format of the top line of the summary, the line that shows the column titles. The default for this template is:
«group»«titles»
When the summary table is generated, the «group» and «titles» tags are replaced with the generated column titles, either automatically generated or specified with the titles option (see above). If you want to create a completely custom top line, simply put the text you want into the template without these tags. If you don’t want any top line at all (no column titles), set this template to empty text (“”).
summarytable( ... , "toptemplate","" , ...)
groupcolumnheadertemplate controls how the text for the «group» tag in the toptemplate is generated (see above). If the textlist format is being used, the default for this template is:
«title»<width:20c>
This makes the first column of the Text List Object approximately 20 characters wide. You can modify this template if you want this column to be narrower or wider, for example 175 points in this example.
summarytable( ... , "groupcolumnheadertemplate","«title»<width:175>" , ...)
If you want plain text, with no tags, just use the «title» tag, like this.
summarytable( ... , "groupcolumnheadertemplate","«title»" , ...)
datacolumnheadertemplate controls how the title for each summary column is generated. If the textlist format is being used, the default for this template is:
«title»<width:«columnwidth»><align:right>
This default template causes each summary column to be right aligned, with automatic width (the «columnwidth» value is generated automatically based on the number of characters in the title and the number of digits in the numbers). If you wanted the columns to be center aligned you could change the template like this:
summarytable( ... , "datacolumnheadertemplate","«title»<width:«columnwidth»><align:center>" , ...)
If you want plain text, with no tags, just use the «title» tag, like this.
summarytable( ... , "datacolumnheadertemplate","«title»" , ...)
titlenametemplate controls how summary column titles are automatically generated. The default for this template is:
«formula» («Operation»)
This will display the formula (usually the field name) followed by the operation (total, average, etc.) in parenthesese. If you wanted to just display the operation name you could modify the template like this:
summarytable( ... , "titlenametemplate","«Operation»" , ...)
If you have explicitly set up column titles with the titles option (see above) this temmplate is ignored.
rowtemplate controls how each row in the body of the summary table is generated. The default for this template is:
«group»«data»
bottomtemplate controls how the bottom row of the summary table is generated (the row that contains the grand total, overall average, etc.). The default for this template is:
TOTALS«data»
If you wanted to change the word TOTALS to another language, or use another word, this template is the place to do it. If you don’t want any bottom row at all (no grand total), set this template to empty text, like this.
summarytable( ... , "bottomtemplate","" , ...)
Minimum and Maximum Column Width
When generating a summary table for a Text List Object, the summarytable( function automatically estimates the column widths based on the number of characters in the title and the number of digits in the numbers. The minimum column width is 9 characters, and the maximum is 30 characters. You can adjust the min/max widths with the minimumcolumnwidth and maximumcolumnwidth options. This example makes the maximum width 25 characters.
summarytable( ... , "maximumcolumnwidth",25 , ...)
Row and Column Separators
The summarytable( function normally puts a carriage return between each row, and a tab between each column. You can customize these separators with the rowseparator and columnseparator options. This example puts a carriage return and linefeed character between each row, and a comma between each column (comma delimited).
summarytable( ... , "rowseparator",cr()+lf(),"columnseparator","," , ...)
As shown in this example, the separators are not limited to single characters, and can in fact be any number of characters.
Empty Summary Table
The empty option specifies what text to output if the function is unable to generate a summary table, for example if the specified database is not currently open. If you don’t specify the empty option an empty table will be generated, with suitable tags if the output is destined for a Text List Object.
Updating a Summary Table
If the summarytable( function is displayed in a form object (usually a Text List Object) you may want to set up a button or menu item to refresh the table (it will not update automatically when the data changes). The sync option allows you to specify a variable that will trigger redisplay. The summarytable( function actually ignores this variable, but the form object will not, and will redisplay when this variable changes. For example, you could specify the variable sumSync (notice that the variable name must not be quoted).
summarytable( ... , "sync",sumSync , ...)
This variable doesn’t have to actually exist, but you can set up a button with this code.
showvariables sumSync
When the button is pressed, the summary table display will update.
Linking a Text List Summary Table With Original Data
In addition to displaying a summary table, a Text List Object can also be be linked back to the original data. For example, the object can be set up so that right clicking on a cell in the summary table selects the original raw data that underlies that summary cell. The first step in setting up this link is adding the windowglobal, fileglobal or global option to the summarytable( function. These options save the specifications for the summary table into a variable. Later when the object is clicked, the code can examine this variable to determine how to handle the click. This example will save the specifications into a windowglobal variable named _summaryInfo.
summarytable( ... , "windowglobal","_summaryInfo" , ...)
Note: If you leave the variable name empty, Panorama will automatically assume you want to use the name _summaryInfo, so this example is exactly the same as the previous example:
summarytable( ... , "windowglobal","" , ...)
Unless you have multiple summary tables on a single form, using _summaryInfo as the name will simplify your life.
Once the summarytable( function is set up to save the specifications, add the following code to the Text List Object. (This example assumes that the specifications have been saved to a variable named _summaryInfo, and that the sync option has been set to a variable named sumSync.
summarytablepopup _summaryInfo,"sumSync"
Now switch to Data mode, right click on a row in the summary table, and choose Select Original Data from the popup menu. Panorama will select the data that underlies the summary row that was clicked on.
To perform this magic, the summarytablepopup statement determines what row was clicked on, then calls the summaryselectoriginalformula statement. This statement examines the specifications in the _summaryInfo variable to determine how to select the underlying data. The _summaryInfo variable contains a dictionary (see Data Dictionaries) with these entries:
- DATABASE - name of database summary table was derived from
- COLUMNS - names of summary table columns
- PATTERNS - numeric patterns of the summary table columns
- ROWS - name of each summary table group (one per line)
- GROUPFORMULA - the formula specified by the groups option
- QUERYFORMULA - the formula specified by the query option
The summaryselectoriginalformula statement uses this information to build a formula that will select the data corresponding to the summary row. Here is code you can use to select the original data based on the currently selected row.
let clickedRow = info("matrixrow")
local selectionFormula,originalDatabase
summaryselectoriginalformula _summaryInfo,clickedRow,selectionFormula,originalDatabase
topdatawindow originalDatabase
if selectionFormula=""
    selectall
else
    execute "select "+selectionFormula
endif
If all this seems a bit complicated, keep in mind that the Summary Workshop wizard can automatically generate a Text List Object with all of the formulas and code already set up for you. Simply choose Make New Summary Table Form from the Summary menu.
See Also
- aggregate( -- calculates an aggregate (sum (total), count, minimum, maximum or average) by scanning specified records in a database.
- Crosstab Workshop -- tool for two dimensional summarizing, analyzing and charting large amounts of data.
- crosstab( -- converts information in a database into a crosstab table (tab delimited text).
- formulasum -- calculates a total by scanning a database, returning the accumulated sum of evaluating a formula over and over again for each scanned record.
- groupdatepattern( -- converts a number representing a date into text in a special format for use with the summarytable( and crosstab( functions. The function uses a pattern to control how the date is formatted (see Date Patterns).
- refreshsummarydatabase -- refreshes a summary database.
- Summary Workshop -- tool for quickly summarizing, analyzing and charting large amounts of data.
- summarydatabaseselectoriginal -- selects original data corresponding to a cell in an exported summary table database.
- summaryselectoriginalformula -- returns the formula that will select the original data associated with a summary table row.
- summarytablepopup -- handles a click on a summary table text list.
History
| Version | Status | Notes |
| 10.1 | New | New in this version. |