Panorama allows you to set up blank forms as individual pages or as a continuous sheet (View-As-List). When forms are set up as individual pages you see one record at a time. You can flip through the records just as you would shuffle through a stack of paper forms.
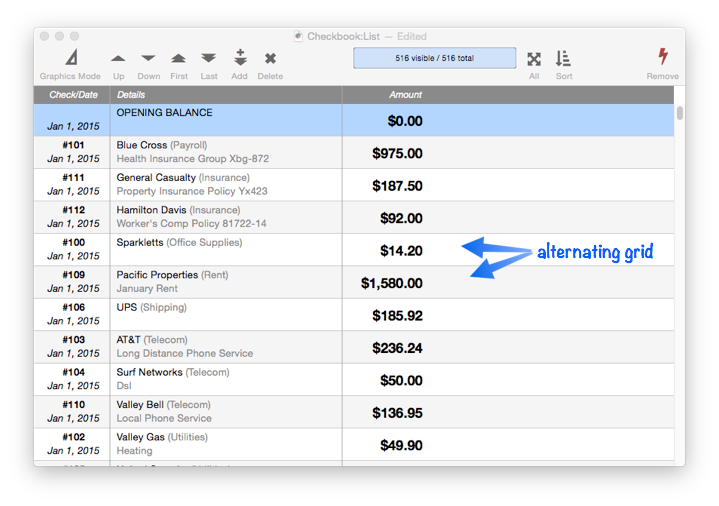
A View-As-List form displays data as a continuous sheet, as shown below. Instead of flipping from record to record, you scroll up and down through the data in a manner similar to the data sheet. However, unlike the data sheet, a view-as-list form allows you to arrange the data any way you like, and even include graphics in the display. On the other hand, view-as-list forms are slower than the data sheet (because of the overhead in displaying the graphics) and they are much more work to set up.
In older versions of Panorama, View-As-List forms were the primary way to display scrollable data other than the data sheet. Panorama X now includes two other powerful methods for displaying scrollable data – the Text List Object and the Matrix Object. Unlike View-As-List forms, these objects allow you to combine scrollable data with other form elements in a single window. In most new applications, we recommend using these objects instead of the View-As-List option.
How View-As-List Forms Work
Panorama displays a View-As-List form by taking a collection of graphic objects and displaying them over and over again, once for each record. For the form in the previous section, the collection of graphic objects looks like this.

As you can see, this collection of objects is just a small portion of a form. How does Panorama know which collection of objects to include? You tell it by enclosing the objects in a special object called a Report Tile Object. Panorama has over 40 different kinds of tiles, but for now we are interested in just two types – data tiles and header tiles.
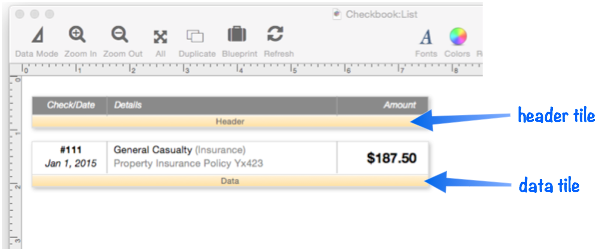
When the form is switched into Data Mode, the tiles disappear and are replaced by the View-As-List view of the data. In this view, objects inside the header tile are displayed at the top of the window, while objects inside the data tile are displayed over and over, once for each record in the database. So in Graphics Mode you can change the arrangement of the data, while in Data Mode, you can scroll to view different parts of the database.
At any time you can flip back into Graphics Mode to make changes to the layout, then flip back into Data Mode to see what those changes look like:
Automatically Constructing a View-as-List Form
Use Panorama’s Automatic Report Construction dialog to quickly set up view-as-list form. Start by creating a blank form (see Creating a New Form), then use the pop-up menu to change the format to View-As-List.

Now open the Report item from the Construct menu. This will open a dialog with a list of fields in the database, and some options.
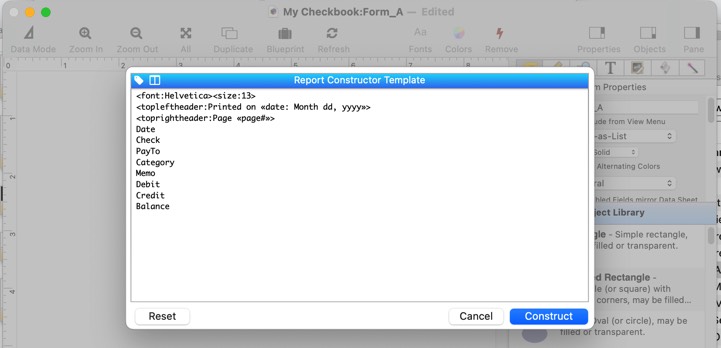
Edit the list to include only the fields you want to display in your view-as-list form. You can also change the order of the fields, and modify the other options as well (such as the font and text size).

Press the Construct button to generate the form. In graphics mode, it will look like this:

Swtich into data mode to see the data displayed in a list.

If necessary you can switch back into graphics mode to make adjustments, or you can even re-open the construct report dialog and re-generate the layout.
Manually Creating a View-As-List Form
In addition to automatically generating a View-As-List form, you can also do this manually. The first step is to create a Data Tile Report Tile Object. The size of this object needs to be adjusted to be the size that you want to use for each element in the View-As-List form.
The next step is to change the Format in the Form Properties panel (the first sub panel of the Object Inspector Panel) from Individual Pages to View-As-List.
That’s it. Now when the form is switched to Data Mode, the View-As-List scrollable display will appear. It is not very interesting because it is blank, but you can see the alternating background color for rows, with the current row highlighted. You can click and scroll to different records in the database.
Now we’re ready to start adding graphics to the form. We’ll start by adding a horizontal line across the top of each record. Switch to Data Mode to see what this configuration looks like. The line is repeated once for each record.
Got the idea? Now we can go back to Graphics Mode and add more objects, for example Text Display Objects to display fields from the database. The View-As-List form kind of works like the data sheet. You can select a different record by clicking on it, or use the vertical scroll bar to navigate to any location within the database.
Adding a View-As-List Header
To add a header to your View-As-List form you’ll need to add a second tile. Surprisingly enough this is called a header tile. There are two methods for creating this tile—you can create it from scratch or you can create it from a copy of the data tile.
To make a copy of the data tile, start by selecting the data tile (by clicking on the drag bar). Then hold down the Option key and drag to make a copy. Once the copy is made, resize it as needed, and use the Object Inspector Panel to change it from a data tile to a header tile (see Report Tile Object).
The final step is to place the graphics and text you want on the header, and then switch to Data Mode to see the results.
Notice that even though the header tile is positioned below the data tile in Graphics Mode, it appears above in Data Mode.
Adjusting View-As-List Geometry
The height of the data tile controls the height of each record in the View-As-List display. If you increase the height of the tile, each record becomes taller.
Similarly, the height of the header tile controls the height of the header. You can make the header as tall or short as you like.
The position and width of the tiles is not important. You need to make the width wide enough to hold your content, but other than that, the position and width have no effect.
View-As-List Forms with Editable Objects
You should not use editable objects, like Text Editor Objects, Data Button Objects or Popup Menu Objects with View-As-List forms. (This was allowed in older versions of Panorama, but does not work in Panorama X.)
View-As-List Background Colors and Grid
In Data Mode, a View-As-List form usually displays with a alternating grid and a solid border between each record.
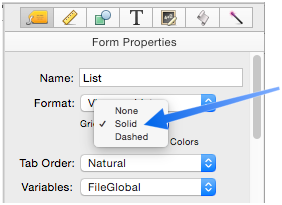
To disable the alternating grid and just use a white background, uncheck the Alternating Colors option.
You can also choose from a solid or dashed separator between rows, or no separator at all.
Advanced tip: Using the Form Options Blueprint tool, you can customize the highlight color, and the alternating row colors. This example sets the alternating colors to light green and blue, and the highlight color (that indicates the currently selected record) to light red.
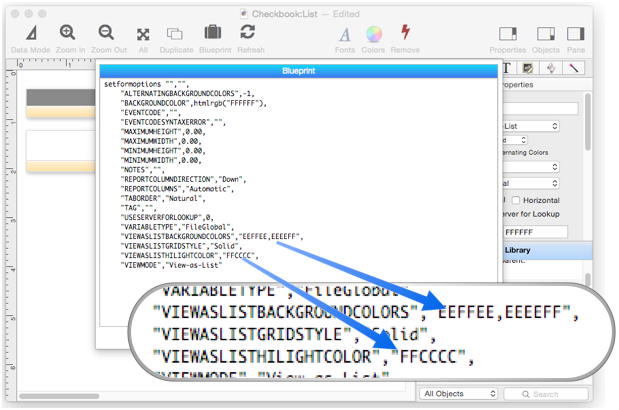
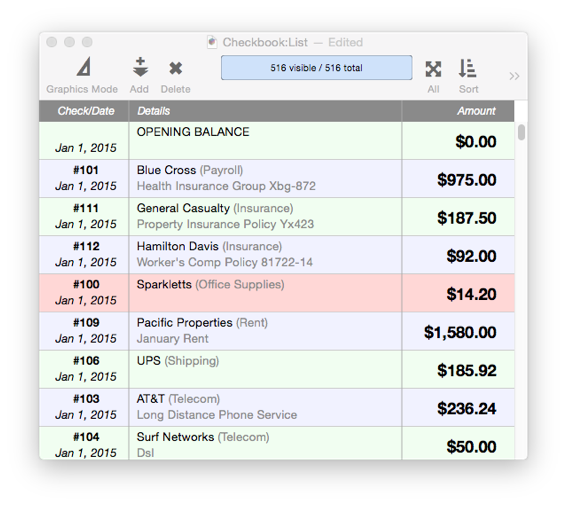
Here’s what these custom colors look like in use.
See Also
- Displaying Data in a Grid -- fundamentals of displaying data in a grid (Text List/Matrix).
History
| Version | Status | Notes |
| 10.0 | Updated | Carried over from Panorama 6.0, but can no longer include editor objects. |