The crosstab( function converts information in a database into a crosstab table (tab delimited text).
Parameters
This function has two parameters:option – The parameters to this function consist of one or more option/value pairs. The first parameter of each pair specifies the option name.
value – The second parameter of each pair contains the value associated with the option. For a list of available options, see the text below.
Description
This function uses the information in a database to build a crosstab table. The word crosstab is short for cross tabulation, referring to the criss-cross way that totals are tabulated both across and down. Probably the most common example of a crosstab is a budget, with months or years across the top, and spending categories down the left.
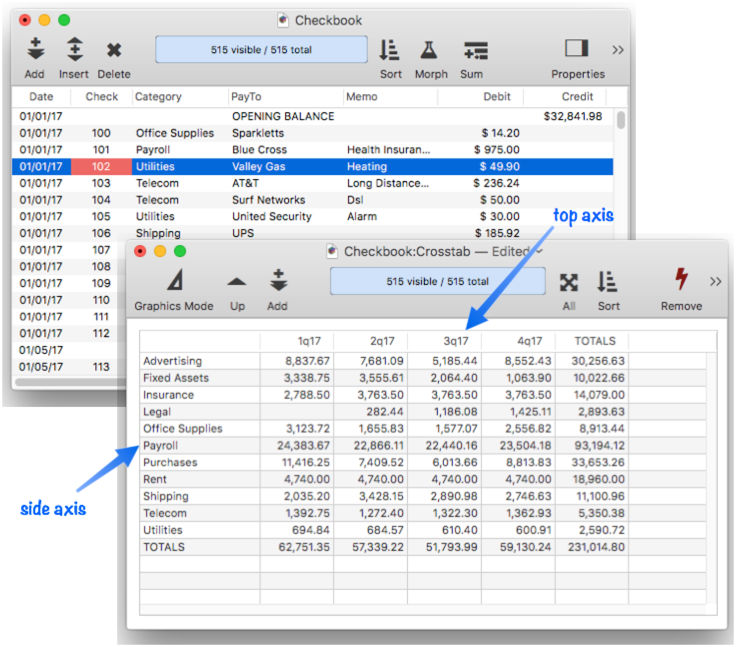
The crosstab table generated by this function is tab delimited text. The text is designed so that it can be dropped right into a Text List object, but you can also export the text to a disk file, or use it to create a new database. Here is an example of a crosstab table displayed in a Text List object. The database containing the raw data the crosstab is based on is shown in the background. The crosstab is grouped by category down the side and quarters across the top.
Crosstab Basics
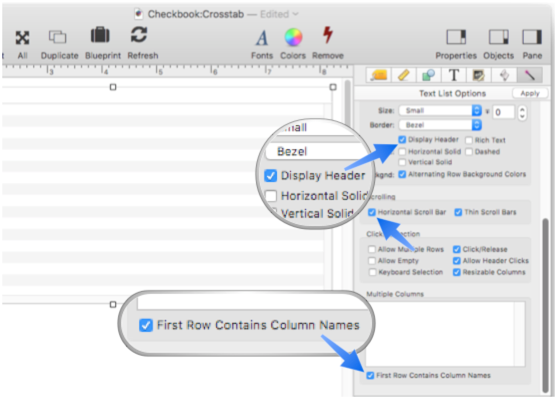
To display a crosstab table in a Panorama form, start by creating a Text List Object, and enable the Display Header and First Row Contains Column Names options. You may also probably want to enable the Horizontal Scroll Bar option. (Note: Instead of creating a crosstab table manually as shown in the steps below, you can ask Panorama’s Crosstab Workshop to create one for you automatically – it’s usually a lot easier and faster to do it this way. See Crosstab Workshop to learn how to do this. Still, learning how to create a crosstab table manually will help if you want total control over the crosstab operation and appearance.)
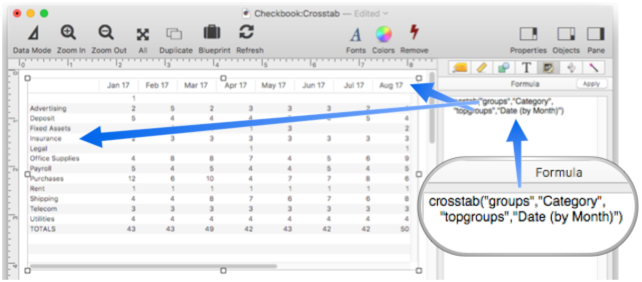
Now switch to the Formula panel and enter the formula:
crosstab("groups","Category","topgroups","Date (by Month)")
When you press the Apply button, the crosstab will appear, as shown below. Notice that the data sheet window doesn’t change, the crosstab is built on-the-fly. The body of the crosstab shows record counts; for example, there were 3 insurance checks written in February 2017.
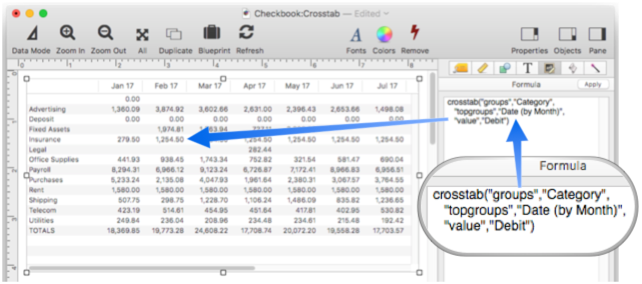
Next I’ll change the formula to calculate the Debit totals for each crosstab cell, instead of counts. The new formula is:
summarytable("groups","Category","topgroups","Date (by Month)","value","Debit")
The summary table now shows the categories with subtotals, and grand totals on the bottom and the right side. Now we can quickly see that in February 2017 spending on insurance was 1,254.50, while total monthly spending was 19,773.28.
Crosstab tables are a fantastic tool for quickly making sense of a large amount of data.
Crosstab Details
Now that you’ve learned the basics of creating a crosstab, let’s dive into the details.
Crosstab Axes
As shown in the illustrations above, a crosstab table has two axes: the side axis and the top axis. Each axis displays information from the database split into groups (sometimes called categories).
Side Axis Values
Use the Group option to specify the data for the side axis. The data is specified as a formula, so it must be quoted. This example uses { and } as quote characters (see Quotes), the formula is simply the Category field.
crosstab("group",{Category})
Because the axis is specified as a formula, you are not limited to a single field. You can combine multiple fields or use partial fields. Here is an example that combines the city and state.
crosstab("group",{City+", "+State})
Note: If you wish you can use side instead of group as the option name, like this.
crosstab("side",{City+", "+State})
Top Axis Values
Use the TopGroup option (or just top) to specify the data for the top axis. Like the side axis, this is specified as a formula, so it must be quoted. This example will generate a crosstab listing Categories down the side and Cities across the top.
crosstab("group",{Category},"topgroup",{City})
One Dimensional Crosstabs
If you leave off the topgroup option, the crosstabs( function will generate a “one dimensional” crosstab. In this case, the output will always have only two columns, the side group names and totals (or counts).
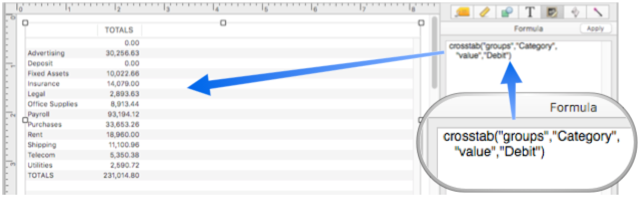
crosstab("group",{Category},"value",{Debit})
Here is what this one dimensional crosstab looks like in a Text List Object.
Note: You can create a similar one dimensional table with the summarytable( function.
Using Dates for Axis Values
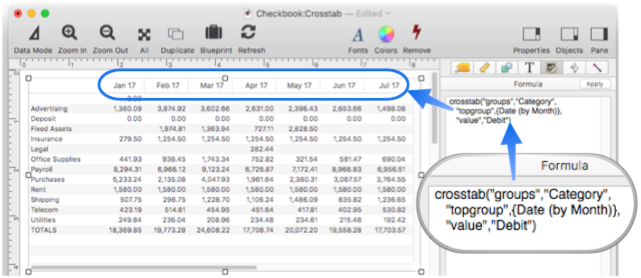
If your database contains dates, you may want one of the axes to be grouped by day, month, quarter or year. The simplest way to do that is simply to add a special suffix to the formula. The suffix is a space followed by (by Day), (by Month), (by Quarter) or (by Year). This example breaks down a checkbook by category vs. month.
crosstab("group",{Category},"topgroup",{Date (by Month)},"value",{Debit})
Here is what this crosstab looks like in a Text List Object.
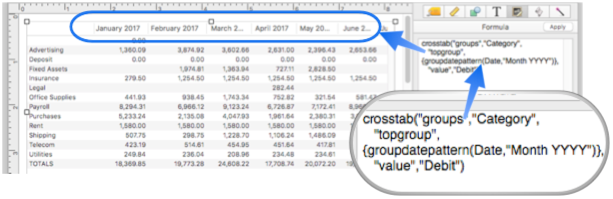
For more control over the date format you can use the groupdatepattern( function. This function is similar to the datepattern( function, but is designed to be compatible with the crosstab( and summarytable( functions. Using the groupdatepattern( function you can format the date using any format supported by the datepattern( function. This example groups the top axis by month, but spells out the entire month name, and displays all four digits of the year.
crosstab("group",{Category},"topgroup",{groupdatepattern(Date,"Month YYYY")},"value",{Debit})
Note: If you use the datepattern( function instead of the groupdatepattern( function, the groups will not appear in the correct order, for example April will appear before January. The groupdatepattern( function adds an extra tag to the text that tells the crosstab( function how to sort the groups (see below).
Grouping in Non-Alphabetic Order
Crosstab groups are normally listed in alphabetic order. By adding a special prefix to the group formula (or topgroup), you can change the order in which groups are listed. The prefix, is used to determine the order of the groups, but is not displayed. The prefix is separated from the actual data with a tab character. For example, suppose you had a database that contained information about Gold, Silver and Bronze medals. Normally these groups would be listed alphabetically as Bronze, Gold and Silver. This code shows how the summarytable( function can be forced to display the items in the traditional order.
crosstab("groups",{replace(Medal,
    "Gold","1"+tab()+"Gold",
    "Silver","2"+tab()+"Silver",
    "Bronze","3"+tab()+"Bronze",
    ...
    )
For date values, the groupdatepattern( function automatically generates the correct prefix to make sure the date summaries are listed in the correct order (see above).
Crosstab Value (Content) Calculations
Each value in the body of the crosstab is calculated by either counting or totaling the data associated with that row and column in the crosstab. If you want to calculate totals, you must supply a Value option. The Value option is specified as a formula. For example, if you have a checkbook database with a Debit field and you want the crosstab to calculate spending totals, the formula would simply be Debit, as shown here.
crosstab(…,"value",{Debit},…)
Usually the value formula is simply a field, but it doesn’t have to be – you can use any formula you want.
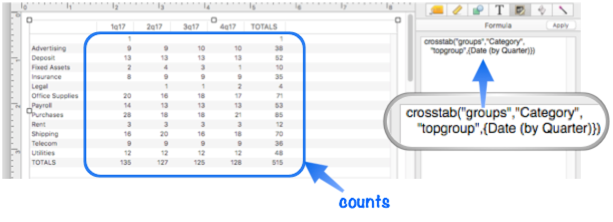
If you want the crosstab to be calculated by counting the records in each group instead of totals, simply omit the value option. This crosstab will display the number of checks in each group, instead of the total value of the checks.
crosstab("group",{Category},"topgroup",{Date (by Quarter)})
Analyzing a Subset
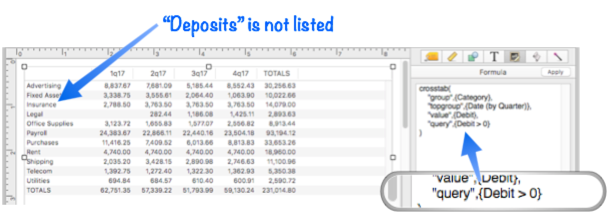
The crosstab( function normally analyzes all of the data in the database, whether visible or not. Use the Query option if you want to analyze only a portion of the data. This option must contain a formula that specifies what data should be included in the analysis. This example checkbook analyzis includes only debits, deposits are excluded.
crosstab(
    "group",{Category},
    "topgroup",{Date (by Quarter)},
    "value",{Debit},
    "query",{Debit > 0}
)
If you would like to analyze only data that is currently selected, use a formula with the info(“visible”) function.
crosstab(…,"query",{info("visible")},…)
Analyzing an Alternate Database
The crosstab( function normally analyzes data from the current database, but using the Database option it can analyze any open database.
crosstab("database","Checkbook",…)
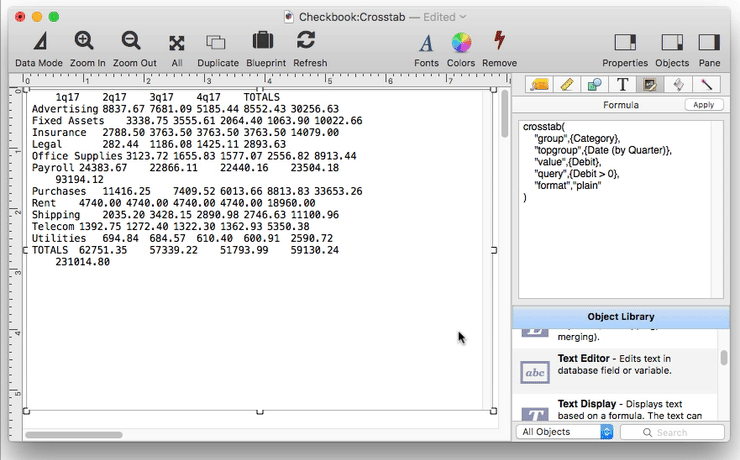
Controlling the Crosstab Output Format
By default, the crosstab( function creates output that is designed for display with a Text List Object, with all totals included. Using the Format option you can quickly customize the output format. (It is also possible to customize individual format options, which is covered further down on this page.)
The two primary choices for this option are textlist and plain. As mentioned above, the textlist option is used when displaying the crosstab in a Text List Object. In this mode, the first line of the output will include tags that tell the Text List Object how to align each column, and the display width of each column (see Text List Multiple Columns to learn about these tags, but you don’t need to learn about them to use the *crosstab(* function since it takes care of generating the correct tags for you).
Use the plain option when you don’t want any extra formatting tags added to the results. For example, this is usually the option to use if you want to export the crosstab data to a text file for import into some other program. In addition to leaving off the formatting tags, in plain mode the numbers do not include thousands separators (for ease of import into other programs).
If the suffix nototals is added to the textlist or plain option, the output result will exclude the bottom row and the right column of the crosstab. In other words, it will only include the body of the crosstab, not the totals on the bottom and right.
If the suffix nobottomtotals is added to the textlist or plain option, the output result will exclude the bottom row of the crosstab. In other words, it will include the body of the crosstab and the totals on the right, but not the totals on the bottom. This option is useful when the topgroup option has been omitted, which means that there is no body.
This video shows how the output changes as the format option is changed (in this example the output is being displayed in a Text Display Object, so that you can see the actual text being output.
If the crosstab( function is being used to generate data for the chart( function, the plainnototals option should normally be used. The chart( function doesn’t want any of the formatting tags or thousand separators in the data. If the topgroup option has been omitted, then the plainnobottomtotals format options should be used (otherwise there will be no values to chart!).
Numeric Formatting
The crosstab( function normally tries to format the numbers it generates in a reasonable way. However, you can override the defaults and customize numeric formatting in a couple of ways.
The digits option specifies how many digits should be displayed after the decimal point (0, 1, 2, 3, etc.). This option only applies when the crosstab is performing totals, if the crosstab is counting the data then the numbers are always displayed as integers (unless you’ve provided a custom pattern, see below). This formula will output the crosstab numeric values to four digits of precision after the decimal point.
crosstab(…,"value","Price","digits",4,…)
The thousands option specifies whether or not thousand separators should appear in the numbers. In this example, no thousand separators will be generated.
crosstab(…,"value","Price","thousands","no", …)
The pattern option specifies a numeric pattern for the numeric output (see Numeric Patterns). If you use this option the digits and thousands options will be ignored. This example will add a dollar sign prefix to each number in the crosstab, as well as including thousand separators.
crosstab(…,"value","Price","pattern","$#,.##", …)
Custom Layout with Templates
Internally, the crosstab( function uses four templates to construct the crosstab output. These templates are normally set up for you when you select a format option (see above), but you can also customize these templates individually. There are four templates you can customize: TopTemplate, ColumnTemplate, RowTemplate and BottomTemplate. When setting up a template you insert tokens for each component, the tokens are surrounded with « and » characters.
The TopTemplate option specifies the format for the top row of the crosstab (the column titles). There are two tokens that can be included in this template:
- «titles» -- the title names
- «groupwidth» -- the width of the group column, which Panorama calculates automatically from the data.
When a plain format is used, the default top template is simply:
«titles»TOTALS
When a textlist format is used, the default top template is:
<width:«groupwidth»>«titles»TOTALS<width:9c><align:right>
If you wanted to customize the group width and use your own value instead of the automatic width, just customize this template. In this example I have also made the width of the totals column wider.
<width:20c>«titles»TOTALS<width:12c><align:right>
The ColumnTemplate option specifies the format for each title column in the top row of the template. There is one token that can be included in this template:
- «columnwidth» -- the width of the column, which Panorama calculates automatically from the title.
When a plain format is used, the default column template is simply:
«title»
When a textlist format is used, the default column template is:
«title»<width:«columnwidth»><align:right>
If you wanted each column to be centered instead of right aligned, the column template would need to be changed to:
«title»<width:«columnwidth»><align:center>
If you wanted each column to be centered and always 100 points wide, no matter what the title lengths are, the column template would be:
«title»<width:100><align:center>
Note: If you are using automatically calculated column widths, you can set the minimum and maximum column widths with the MinimumColumnWidth and MaximumColumnWidth options. These are specified in characters, not points. The defaults are a minimum of 9 characters (or 8 if counting instead of totalling), and a maximum of 30 characters.
The RowTemplate option specifies the format for each row in the body of the crosstab. There are three tokens that can be included in this template:
- «group» -- the group for this row of the crosstab
- «data» -- the set of data items for this row of the crosstab (there is no token for individual items)
- «total» -- the total for this row of the crosstab.
This template is usually set up as:
«group»«data»«total»
The BottomTemplate option specifies the format for the bottom row of the crosstab, which displays totals for each column. There are two tokens that can be included in this template:
- «data» -- the set of data items for this row of the crosstab (in this case, these are totals)
- «total» -- the total for this row of the crosstab.
If you don’t want to include the bottom row, set this option to "" (empty text). Normally, this template is set up as:
TOTALS«data»«total»
In addition to the four templates, you can also specify the “Empty” option. This specifies what should be output if the crosstab can’t be performed, for example if the specified database is not open.
To illustrate the operation of these templates, the following examples show how some of the common format options could be implemented using these low level templates. For example this formula:
crosstab("format","textlist",…)
Is the same as:
crosstab("TopTemplate"," <width:«groupwidth»>«titles»TOTALS<width:9c><align:right>",
    "ColumnTemplate","«title»<width:«columnwidth»><align:right>",
    "RowTemplate","«group»«data»«total»",
    "BottomTemplate","TOTALS«data»«total»",
    "Thousands","YES",
    "Empty"," "+tab()+"TOTALS<align:right><width:9c>"+cr()+"TOTALS"+tab()+"0",
    …)
While this formula:
crosstab("format","plain",…)
Is the same as:
crosstab("TopTemplate","«titles»TOTALS",
    "ColumnTemplate","«title»",
    "RowTemplate","«group»«data»«total»",
    "BottomTemplate","TOTALS«data»«total»",
    "Thousands","NO",
    "Empty",tab()+"TOTALS"+cr()+"TOTALS"+tab()+"0",
    …)
And the formula:
crosstab("format","plainnototals",…)
Is the same as:
crosstab("TopTemplate","«titles»",
    "ColumnTemplate","«title»",
    "RowTemplate","«group»«data»",
    "BottomTemplate","",
    "Thousands","NO",
    "Empty","",
    …)
Row and Column Separators
Normally the crosstab( function puts a carriage return character between lines, and a tab character between columns. You can use the ColumnSeparator and RowSeparator options to change this. This formula will output a line feed between lines, and a comma and space between columns.
crosstab(…,"RowSeparator",lf(),"ColumnSeparator",", ",…)
As shown in this example, the separator characters are not limited to a single character (and in fact there is no limit).
Empty Crosstab Table
The empty option specifies what text to output if the function is unable to generate a crosstab table, for example if the specified database is not currently open. If you don’t specify the empty option an empty table will be generated, with suitable tags if the output is destined for a Text List Object.
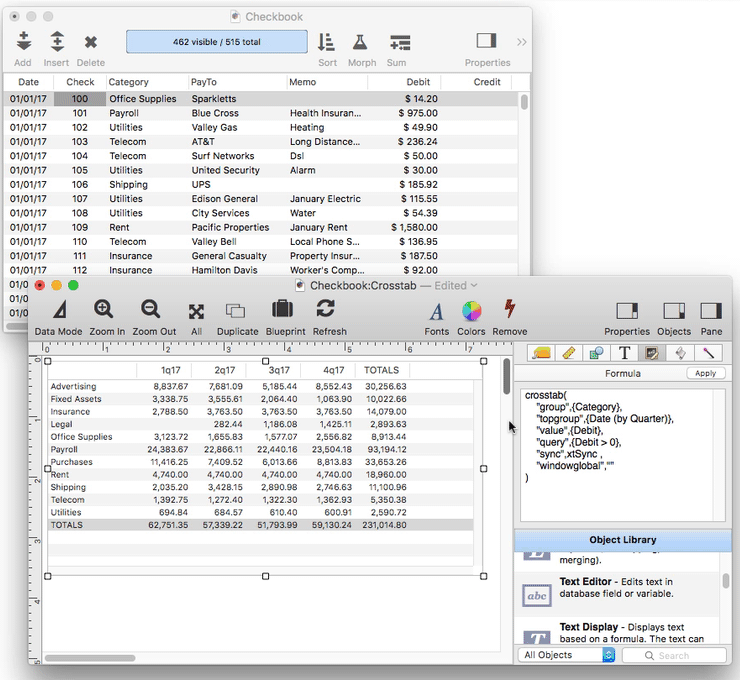
Updating a Crosstab Table
If the crosstab( function is displayed in a form object (usually a Text List Object) you may want to set up a button or menu item to refresh the crosstab display (it will not update automatically when the data changes). The sync option allows you to specify a variable that will trigger redisplay. The crosstab( function actually ignores this variable, but the form object will not, and will redisplay when this variable changes. For example, you could specify the variable crossSync (notice that the variable name must not be quoted).
crosstab( ... , "sync",crossSync , ...)
This variable doesn’t have to actually exist, but you can set up a button with this code.
showvariables crossSync
When the button is pressed, the crosstab table display will update.
Linking the Crosstab to the Original Database
If the crosstab is displayed in a Text List Object, that object can be programmed to link back to the original data. For example, this could allow the user to click on a crosstab cell and select the original data that went into that cell. To enable this, the crosstab( function creates a variable that saves the specifications of the crosstab. Then when the cell is clicked, a program can retrieve those specifications and use them to locate the original data.
If the crosstab( function contains a WindowGlobal, FileGlobal or Global option, that option specifies the name of a variable that the function will save the specifications into. (If the name is "" (empty), the name _crosstabInfo will be used.)
Once the crosstab( function is set up to save the specifications, add the following code to the Text List Object. (This example assumes that the specifications have been saved to a variable named _crosstabInfo, and that the sync option has been set to a variable named crosstabSync.
crosstabpopup _crosstabInfo,"crosstabSync"
Now switch to Data mode, right click on a row in the crosstab table, and choose Select Original Data from the popup menu. Panorama will select the data that underlies the crosstab cell that was clicked on.
To perform this magic, the crosstabpopup statement determines what row and column was clicked on, then calls the crosstabselectoriginalformula statement. This statement examines the specifications in the _crosstabInfo variable to determine how to select the underlying data. The _crosstabInfo variable contains a dictionary (see Data Dictionaries) with these entries:
- DATABASE - name of database the crosstab was derived from
- COLUMNS - names of crosstab columns (one per line)
- ROWS - name of each crosstab group (one per line)
- GROUPFORMULA - the formula specified by the groups option
- TOPFORMULA - the formula specified by the topgroups option
- QUERYFORMULA - the formula specified by the query option
The crosstabselectoriginalformula statement uses this information to build a formula that will select the data corresponding to the crosstab row and column. Here is code you can use to select the original data based on the currently selected row and column.
let clickedRow = info("matrixrow")
let clickedColumn = info("matrixcolumn")
local selectionFormula,originalDatabase
crosstabselectoriginalformula crosstabInfo,clickedRow,clickedColumn,selectionFormula,originalDatabase
topdatawindow originalDatabase
if selectionFormula=""
    selectall
else
    execute "select "+selectionFormula
endif
If all this seems a bit complicated, keep in mind that the Crosstab Workshop wizard can automatically generate a Text List Object with all of the formulas and code already set up for you. Simply choose Make New Crosstab Form from the Crosstab menu.
See Also
- aggregate( -- calculates an aggregate (sum (total), count, minimum, maximum or average) by scanning specified records in a database.
- Crosstab Workshop -- tool for two dimensional summarizing, analyzing and charting large amounts of data.
- formulasum -- calculates a total by scanning a database, returning the accumulated sum of evaluating a formula over and over again for each scanned record.
- groupdatepattern( -- converts a number representing a date into text in a special format for use with the summarytable( and crosstab( functions. The function uses a pattern to control how the date is formatted (see Date Patterns).
- refreshsummarydatabase -- refreshes a summary database.
- Summary Workshop -- tool for quickly summarizing, analyzing and charting large amounts of data.
- summarydatabaseselectoriginal -- selects original data corresponding to a cell in an exported summary table database.
- summaryselectoriginalformula -- returns the formula that will select the original data associated with a summary table row.
- summarytable( -- scans a database to build a text array containing summary breakdown information: totals, averages, etc.
- summarytablepopup -- handles a click on a summary table text list.
History
| Version | Status | Notes |
| 10.1 | New | New in this version. |