In addition to the Summarize & Analyze Dialog you can also generate summaries “manually” step by step with individual group, calculate and outline commands. (This technique will be familiar to users of older versions of Panorama. Before Panorama 6, the techniques described below were the only way to generate summaries.)
STEP 1 - GROUP
The first step in manually summarizing a database is to divide the database into groups or categories. For example, a checkbook database could be arranged into groups by month (Jan, Feb, Mar, etc.), by budget category (rent, food, transportation, etc.), or by payee (Evian Apartments, Lakeman’s Market, Unocal, etc.).
To divide a database into groups, first click anywhere in the field you want to group. Then use either the Group Up or Group Down command (Field>Analyze menu) to divide the database. The Group Up command arranges the data into ascending order—A’s first, Z’s last. The Group Down command arranges the data in descending order, Z to A.
In addition to the Field>Analyze menu, you’ll also find the Group Up command in the context menu for each field. If you are using a mouse you can right-click on the field name to see this menu, trackpad users can click with two fingers. In this example, Group Up is used to divide this checkbook database into groups by payee.
Subgroups — Groups can be sub-divided into even smaller subgroups. For example if you had arranged a checkbook into groups by month, you could further divide each month into subgroups by payment category. You can continue subdividing the groups up to six times (up to seven levels of groups within groups).
Grouping by Week, Month, Quarter, or Year — When grouping a field containing dates, Panorama gives you the option of how long each group should be — a week, month, quarter, or year.
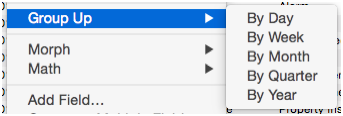
You can group dates more than once — for instance first by year, then by month. This produces subgroups (in this case by month) within the larger groups (by year).
Grand Total — When you arrange a database into groups, Panorama automatically creates an additional summary record at the bottom of the database. This summary record is for the largest group of all, the entire database. When totals or other summary calculations are performed, this summary record holds the overall grand total (or average, count, etc.) for all of the selected records in the entire database.
Grouping a database by month, quarter, or year does not change the way the dates are displayed. You may want to change the output pattern for the date field so that only the month, quarter, or year is displayed, instead of the entire date. The output pattern is specified as part of the design sheet. To display only the month and year, use an output pattern like Mon-yy or mm-yy. To display only the quarter and year, the pattern could be qqqyy or Qtr “Qtr” yy. To display the year only, the pattern could simply be yy or yyyy. See Date Patterns for more information about date output patterns and how to set them up.
If you print a database that is grouped by month, quarter, or year, you can use different summary tiles to format the dates properly (see Printing Summary Information().
STEP 2 - CALCULATE
Once the database has been arranged into groups, the next step is to calculate the summary information. The Field>Analyze submenu has 5 different kinds of summary calculations). These calculations are also available by right clicking on the field name:
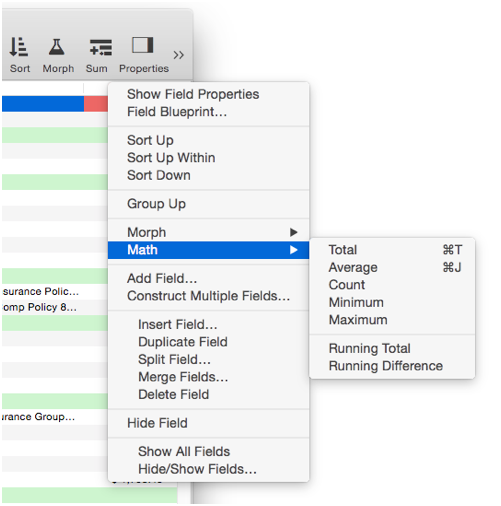
To perform a calculation, first pick the field you want to calculate by clicking on it. Then choose the calculation command (Total, Average, etc.). Panorama will calculate the summaries for each sub-group, group, and for the entire database.
Total — The Total command adds up the data in the current field. It calculates subtotals for each group and the grand total for the entire database. The Total command can only be used with numeric fields. If you attempt to total a text, date, or choice field, Panorama will display a warning message.
Count — The Count command counts the number of non-empty data cells in the current field. If the database is arranged into groups, it will also count the number of non-empty data cells in each group. Empty data cells will not be counted. You can count any field containing either text or numbers, but dates cannot be counted. (Date fields cannot be counted because Panorama would be unable to correctly display the result.)
Average — The Average command averages the data in the current field, calculating sub averages for each group and the overall average for the entire database. Averages can only be computed for numeric and date fields. If you attempt to average a non-numeric field Panorama will display a warning message.
Minimum — The Minimum command finds the smallest value in the current field. If the database is arranged into groups, it will find the smallest value in each group and sub-group. The Minimum command can be used with text, numeric or date fields.
Maximum — The Maximum command finds the largest value in the current field. If the database is arranged into groups, it will find the largest value in each group and sub-group. The Maximum command can be used with text, numeric or date fields.
STEP 3 - OUTLINE
Outlines are a way of organizing information into groups within groups. Panorama’s group commands rearrange your database into an outline structure. Tip: Unlike most outlines which start from the top, Panorama’s outline is upside-down… it starts from the bottom.
Unlike a paper outline, a Panorama outline can be expanded or collapsed to show more or less detail. This makes it easy to spot overall trends in your data, and then zero in on the details behind those trends. See Expanding and Collapsing the Summary Outline to learn the details.
You can set up a form for printing summary information – see Printing Summary Information to learn more.
See Also
- Deleting All Summary Records -- when finished with summary records, they must be deleted.
- Deleting Raw Data Records -- converting summaries into data.
- Expanding and Collapsing the Summary Outline -- to see more or less detail.
- groupseq( -- returns the sequence number within a summary level.
- Printing Summary Information -- printing a database that has been organized into categories with summary records.
- Ranking Summaries -- ranking summary values
- Running Difference -- calculating a running difference down an entire database column.
- Running Total -- calculating a running total down an entire database column.
- Summarize & Analyze Dialog -- is a one stop dialog for creating and filling in summary records based on pre-selected criteria.
- Summarize & Analyze Favorites -- saving and recalling favorite summaries.
- Summary Records -- are temporary records used for calculating totals, subtotals, and other summary information.
History
| Version | Status | Notes |
| 10.0 | No Change | Carried over from Panorama 6.0 |